Finding any kind of averages of the data helps us see trends and patterns in everyday data. Whether you want to keep your savings in check or track how hot it has been this summer, averages smooth out the bumpy details and give us a clear idea about the data. Cumulative Averages also simplify complex data. In this article, we will learn how to find the Cumulative Average in R.
How to Find Cumulative Average in R?
Cumulative average is the average of all values of a dataset up to a given value. It is useful for understanding patterns in data over time while also maintaining context.
Cumulative average, unlike simple averages, considers the entire dataset's evolution. It is particularly useful for datasets with a cumulative nature, like financial or sequential data.
However, it is sensitive to extreme values and may hide short-term fluctuations. So, cumulative averages are a better alternative when a long-term perspective is more important than small, immediate fluctuations.
The cumulative average is calculated as:

In R, it is usually written as:
Cumulative Average = cumsum(data) / seq_along(data)
Seq_along(data) is the sequence of numbers representing the positions in the data. It helps to calculate the average at each step.
The most basic way to calculate the cumulative average of a given data is by using a loop. Here is how you do it:
data <- c(5, 8, 18, 12, 24)

# Initialize an empty vector for cumulative averages
cumulative_average <- numeric(length(data))

# Calculate cumulative average using a loop
for (i in 1:length(data)) {
  cumulative_average[i] <- mean(data[1:i])
}

cumulative_average
Output:
5.00000 6.50000 10.33333 10.75000 13.40000
But the most efficient way to do this in R is by using the cumsum() function. It adds up the values one by one and stores the running totals in a new vector.
# Sample dataframe of Monthly Spending
spendings <- data.frame(
  Person = c("Mare", "Billy", "Evie", "Johnny"),
  Jan = c(30, 25, 15, 22),
  Feb = c(35, 20, 18, 30),
  Mar = c(28, 22, 20, 25)
)

# Calculating cumulative average for each month
spendings $CA_Jan <- cumsum(spendings$Jan) / seq_along(spendings$Jan)
spendings $CA_Feb <- cumsum(spendings$Feb) / seq_along(spendings$Feb)
spendings $CA_Mar <- cumsum(spendings$Mar) / seq_along(spendings$Mar)

# Print the result
print(spendings)
Output:
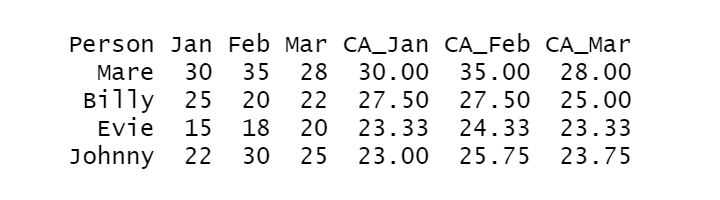
Here, the term seq_along(data) can be replaced with (1:length(data)). This creates a sequence of numbers from 1 to the length of the vector.
Cumulative Average Using dplyr
The dplyr package has a function called cummean() which can be used to calculate the cumulative average. It is quick and straightforward. Using dplyr also has the bonus of pipelining. Let’s replicate the same result as before to get a better understanding.
Let's take an example:
# Load the dplyr package
library(dplyr)

# Calculate cumulative average for each person using cummean() from dplyr and round to 2 decimals
spendings <- spendings %>%
  mutate(Cum_Avg_Jan = round(cummean(Jan), 2),
         Cum_Avg_Feb = round(cummean(Feb), 2),
         Cum_Avg_Mar = round(cummean(Mar), 2))

# Print the result
print(spendings)
Output:
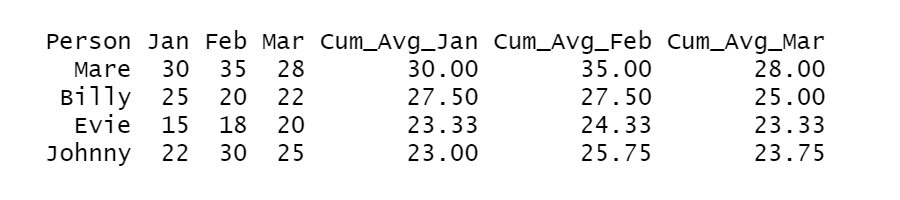
However, this method does not provide the customization and control that the previous method does. So, use cummeans() when you want to calculate quick cumulative averages with minimal code.
The dplyr also helps to reorder columns in R.
Conclusion
In a nutshell, cumulative averages in R help us understand trends in the data without getting lost in the details. It helps to simplify complex information and provides a broader view of patterns over time. The cumsum() function coupled with seq_along() makes the process more efficient and user-friendly.