Hypothesis testing helps you investigate whether a pattern you notice in the data is a real thing or just random noise. This is required to make sense of trends and understand whether we are on the right track or if we need to rethink things. In this article, we will learn about the Wilcoxon rank-sum test in R.
What is Statistical Hypothesis Testing?
Statistical hypothesis testing is a process of using statistical methods to infer the validity of a hypothesis based on a sample of data. More simply, it helps us decide if a hypothesis we have about a larger group is likely true or not, by looking at a smaller part of that group.
There are various methods to perform statistical hypothesis testing, and these are broadly divided into two categories: parametric and non-parametric.
Parametric tests assume that our data follows a known and specific distribution. On the other hand, non-parametric tests are more like flexible tools, not relying on strict assumptions about the data's distribution. They are handy when we're not sure about the characteristics of our data.
Now, let's look at the Wilcoxon rank-sum test.
What is the Wilcoxon Rank Sum Test?
The Wilcoxon rank sum test, also known as the Mann-Whitney U test, is a non-parametric test used to compare the distributions of two independent samples. It is tailored for ordinal or continuous data that might not satisfy the normality assumptions necessary for parametric tests such as the t-test. It works best with small sample sizes and is robust against outliers.
Being a non-parametric technique, it makes fewer assumptions than parametric methods. However, there are still some assumptions that need to be considered. They are:
- Data should be collected through a random sampling process.
- The two groups are independent of each other.
- The data is either ordinal or continuous.
This testing method works in the following way:
- Ranking: Combine the data from both groups and rank them in ascending order. If the observations are tied, then we assign them their average rank. Eg: If Rank 2 and Rank 3 have the same values, then both of them would get a rank of 2.5.
- The sum of Ranks: Calculate the sum of ranks for each group:
- Test Statistic (U): The U statistic is the smaller of the two sums of ranks. If U is small, it suggests that values from Group A tend to be smaller than values from Group B, and vice versa.
- Comparison with Critical Values: We would then compare the calculated U statistic with critical values from the Mann-Whitney U distribution table for a given level of significance and degrees of freedom.
If the calculated U is smaller than the critical value, we would reject the null hypothesis and conclude that there is a significant difference between the two groups. Usually, the critical threshold used is the p-value.
Wilcoxon Rank Sum Test in R
The wilcox.test() function is used to perform this statistical testing in R.
Here is its syntax:
wilcox.test(formula, data, alternative, mu, paired, exact, correct, conf.int, conf.level)
These are the parameters:
- formula: A formula representing the variables to be tested.
- data: The dataset containing the variables specified in the formula.
- alternative: Specifies the alternative hypothesis. Use two.sided for a two-tailed test (default), less for a one-tailed test where the alternative hypothesis focuses on a negative effect, and greater for a one-tailed test where the alternative hypothesis focuses on a positive effect.
- mu: The hypothesized median (default is 0). This parameter is relevant when you want to test against a specific value other than the median.
- paired: A boolean indicating whether the samples are paired (default is FALSE).
- exact: A boolean indicating whether to compute an exact p-value (default is NULL).
- correct: A boolean indicating whether to apply continuity correction (default is TRUE).
- conf.int: A boolean indicating whether to compute a confidence interval for the true location shift (default is FALSE).
- conf.level: The confidence level for the confidence interval (default is 0.95).
Now, let’s look at an example using the mtcars dataset.
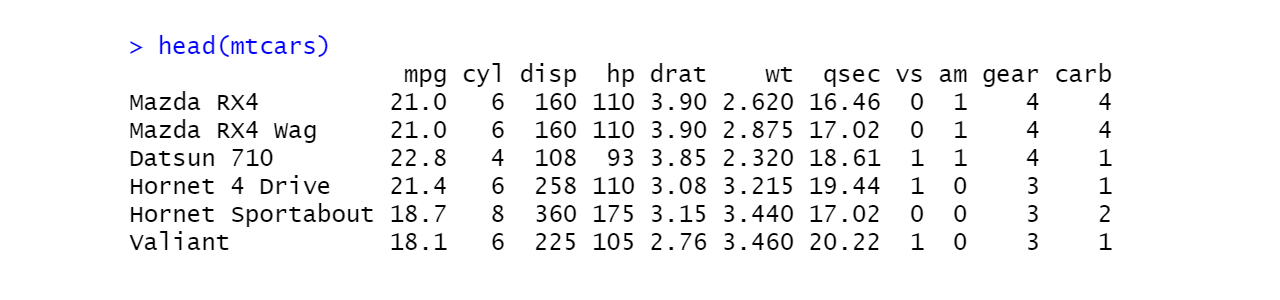
mtcars is a built-in dataset in R that contains information about different car models. We will specifically be looking at two columns: "mpg" (miles per gallon) and "am" (transmission type, where 0 typically means automatic and 1 means manual).
The Wilcoxon Rank Sum Test is being used to check if there's a significant difference in fuel efficiency (mpg) between cars with automatic and manual transmissions. Let's take an example:
# Load the mtcars dataset
data(mtcars)

# Print the first few rows of the dataset to understand its structure
head(mtcars)
Output:
# Perform Wilcoxon Rank-Sum Test to compare mpg between automatic and manual transmission cars
wilcox.test(mpg ~ am, data = mtcars)
Output:
Wilcoxon rank sum test with continuity correction
data: mpg by am
W = 42, p-value = 0.001871
alternative hypothesis: true location shift is not equal to 0
Let's interpret each part of the result obtained:
- Test Type: "Wilcoxon rank sum test with continuity correction" indicates the specific version of the test that was performed.
- Data Description: "data: mpg by am" indicates that the test is comparing the "mpg" variable based on the "am" variable.
- Test Statistics (W): "W = 42" is the test statistic. As discussed before, this is the smaller of the two sums of ranks.
- P-Value: "p-value = 0.001871" is the p-value associated with the test. It represents the probability and is a measure of how strong the evidence is.
- Alternative Hypothesis: "Alternative hypothesis: true location shift is not equal to 0" indicates that the alternative hypothesis is true. If the null hypothesis was true, we would’ve gotten the “alternative hypothesis: true location shift is equal to 0”
Since the p-value (0.001871) is much smaller than the threshold (0.05), we have strong enough evidence to say, "Yes, there seems to be a real difference in fuel efficiency between automatic and manual cars."
The alternative hypothesis, indicating a true shift in location (median), is supported by the data. Therefore, we reject the idea that there's no difference (null hypothesis).
Multiple Wilcoxon Test
Multiple Wilcoxon tests, also called pairwise comparisons or post-hoc tests, are conducted after finding out that there is a significant difference among multiple groups. It is to figure out exactly where the differences are when you know there's a difference somewhere.
Let's look at a simple example using the same mtcars dataset.
Let's assume you've already conducted a non-parametric test (that is suitable for variables with more than two groups) and found that there's a difference in miles per gallon (mpg) among different numbers of cylinders (cyl). Now, you want to find out which specific pairs of cylinder numbers differ from each other. Here is an example:
# Load the mtcars dataset
data(mtcars)

# Kruskal-Wallis test to check for overall differences
kruskal.test(mpg ~ cyl, data = mtcars)

# Multiple Wilcoxon tests for pairwise comparisons
pairwise.wilcox.test(mtcars$mpg, mtcars$cyl, p.adjust.method = "BH")
Output:
Pairwise comparisons using Wilcoxon rank sum test with continuity correction
data: mtcars$mpg and mtcars$cyl
4 6
6 0.001 -
8 8.3e-05 0.001
P value adjustment method: BH
Here, the p-values have been adjusted using the Benjamini-Hochberg (BH) method. This adjustment helps control the familywise error rate when conducting multiple comparisons.
In the output, the rows (6, 8) and columns (4, 6) represent the number of cylinders. The cell contents represent the p-values associated with each pair comparison.
From this table, we can conclude that there are differences in mpg among cars with different numbers of cylinders. Specifically, there are statistically significant differences between 4-cylinder and 6-cylinder cars (p-value = 0.001), 4-cylinder and 8-cylinder cars (p-value < 0.0001), and 6-cylinder and 8-cylinder cars (p-value = 0.001).
Paired and Unpaired Wilcoxon Test
This is another notable concept in the Wilcoxon test. Wilcoxon tests are broadly classified into two groups: paired and unpaired.
Paired Wilcoxon (or Wilcoxon Signed-Rank Test): This is for comparing two things that are connected, like before and after measurements on the same subjects. It is good for studying changes over time within the same group. Eg: checking if students' scores improve after a class.
Unpaired Wilcoxon (or Wilcoxon Rank Sum Test): This is for comparing two things that aren't connected, like measurements from different groups of subjects. It doesn't consider any relationship between the subjects. It is great for comparing two independent groups when data isn't normally distributed. Eg: checking if two different teaching methods have different effects.
Conclusion
In a nutshell, statistical hypothesis testing helps us figure out if what we believe about a larger group is likely true by looking at a smaller sample. The Wilcoxon Rank Sum Test in R is one such testing method that is used to compare two independent samples, especially when our data doesn't follow a specific distribution.