
Once you start exploring the world of data science you realize there’s no end to possibilities and there are numerous algorithms and techniques to train a model depending upon different kinds of data, the data structure, and the model output.
One of the most common machine learning algorithms is regression analysis which is a supervised learning algorithm where you train labeled data to output continuous variables. With different types of regression algorithms, it's important to choose the right algorithm depending on your data and the problem your model solves. In this tutorial we will discuss different types of regression analysis in machine learning and data science, why do we need regression analysis, and how to choose the best algorithm according to the data so as to get optimum model test accuracy.
So let’s get Kraken!
What is Regression Analysis?
A predictive modeling technique that evaluates the relation between dependent (i.e. the target variable) and independent variables is known as regression analysis. Regression analysis can be used for forecasting, time series modeling, or finding the relation between the variables and predict continuous values. For example, the relationship between household locations and the power bill of the household by a driver is best studied through regression.
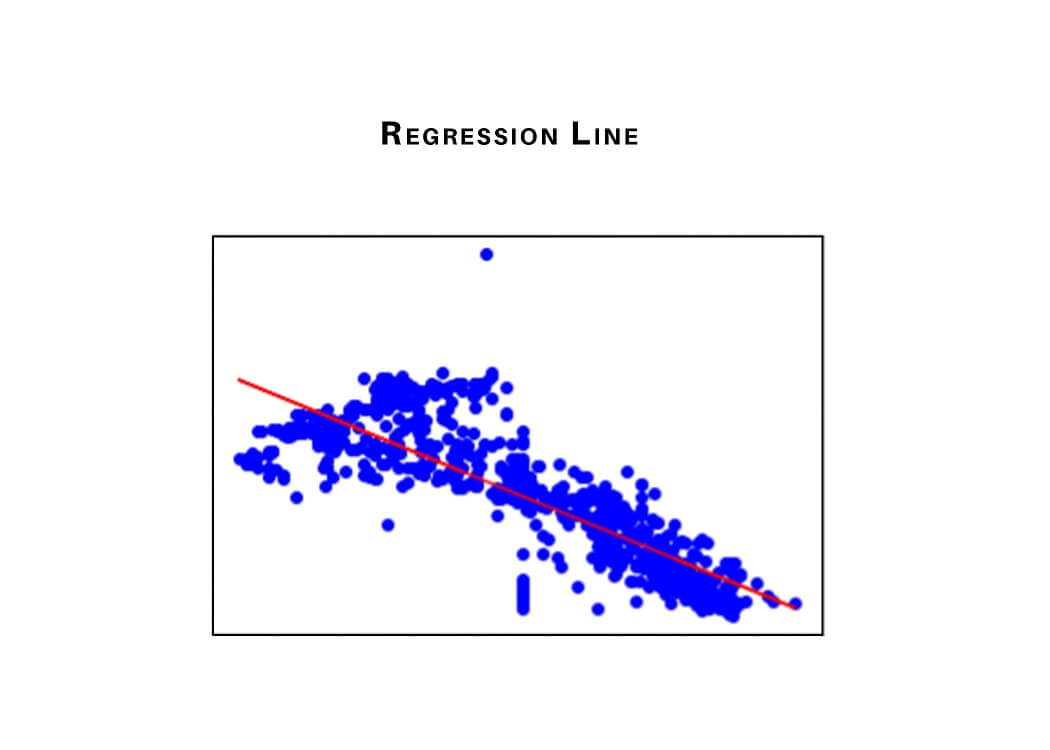
We can analyze data and perform data modeling using regression analysis. Here, we create a decision boundary/line according to the data points, such that the differences between the distances of data points from the curve or line are minimized.
Need for Regression techniques
The applications of regression analysis, advantages of linear regression, as well as the benefits of regression analysis and the regression method of forecasting can help a small business, and indeed any business, create a better understanding of the variables (or factors) that can impact its success in the coming weeks, months and years into the future.
Data are essential figures that define the complete business. Regression analysis helps to analyze the data numbers and help big firms and businesses to make better decisions. Regression forecasting is analyzing the relationships between data points, which can help you to peek into the future.
9 Types of Regression Analysis
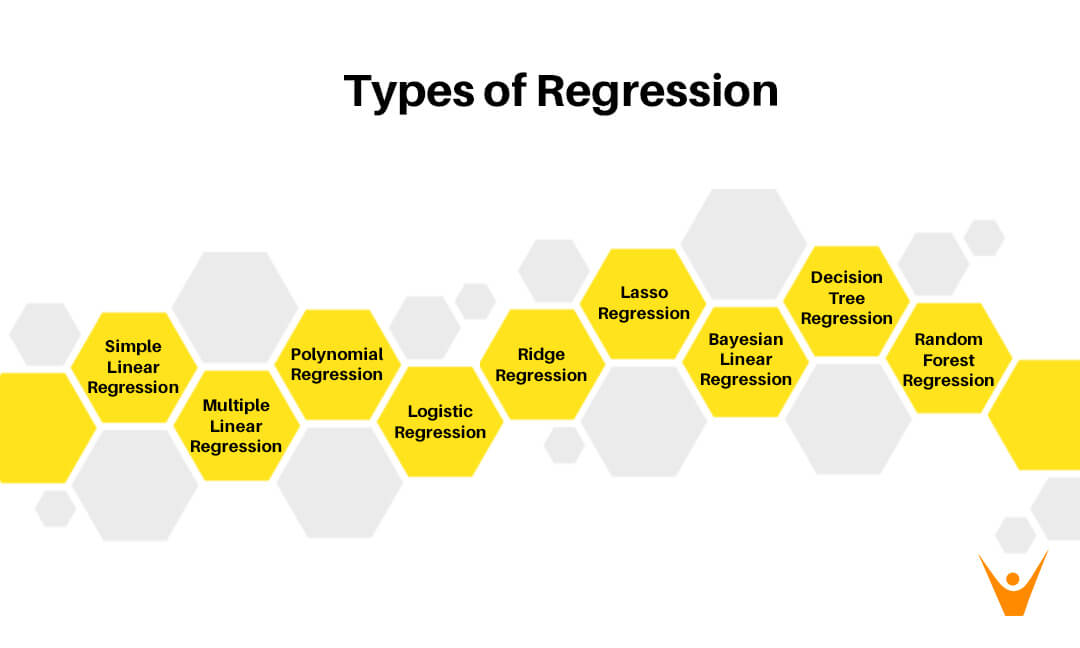
The types of regression analysis that we are going to study here are:
- Simple Linear Regression
- Multiple Linear Regression
- Polynomial Regression
- Logistic Regression
- Ridge Regression
- Lasso Regression
- Bayesian Linear Regression
There are some algorithms we use to train a regression model to create predictions with continuous values.
- Decision Tree Regression
- Random Forest Regression
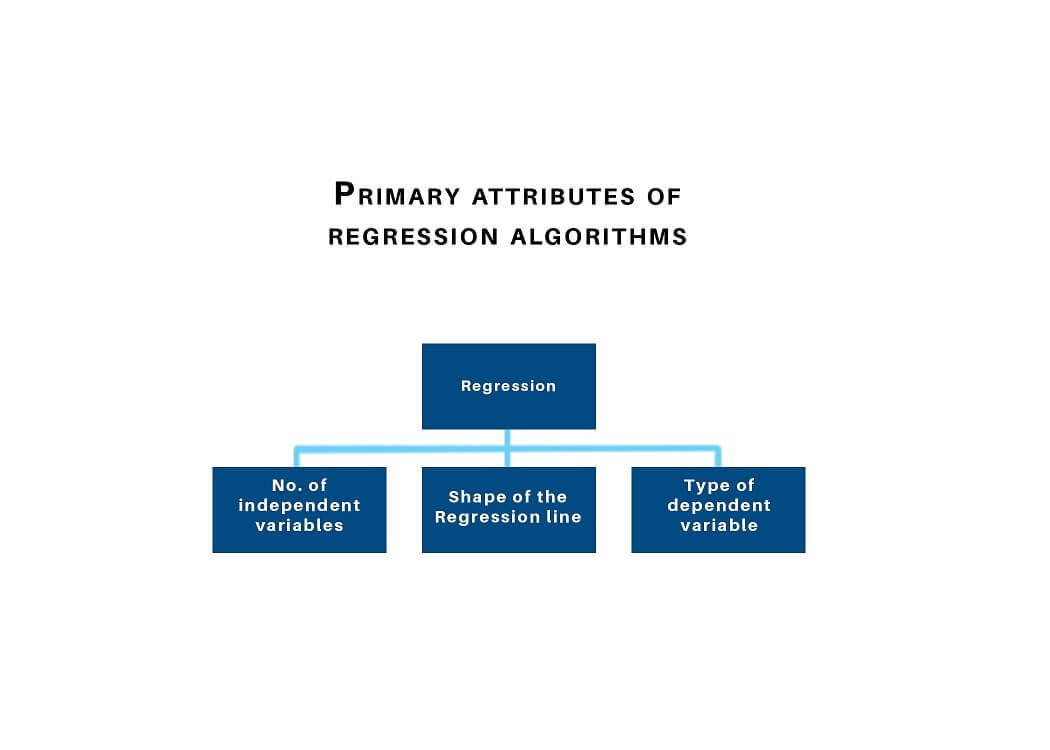
There are various different types of regression models to create predictions. These techniques are mostly driven by three prime attributes: one the number of independent variables, second the type of dependent variables, and lastly the shape of the regression line.
1) Simple Linear Regression
Linear regression is the most basic form of regression algorithms in machine learning. The model consists of a single parameter and a dependent variable has a linear relationship. When the number of independent variables increases, it is called the multiple linear regression models.
We denote simple linear regression by the following equation given below.
y = mx + c + e
where m is the slope of the line, c is an intercept, and e represents the error in the model.
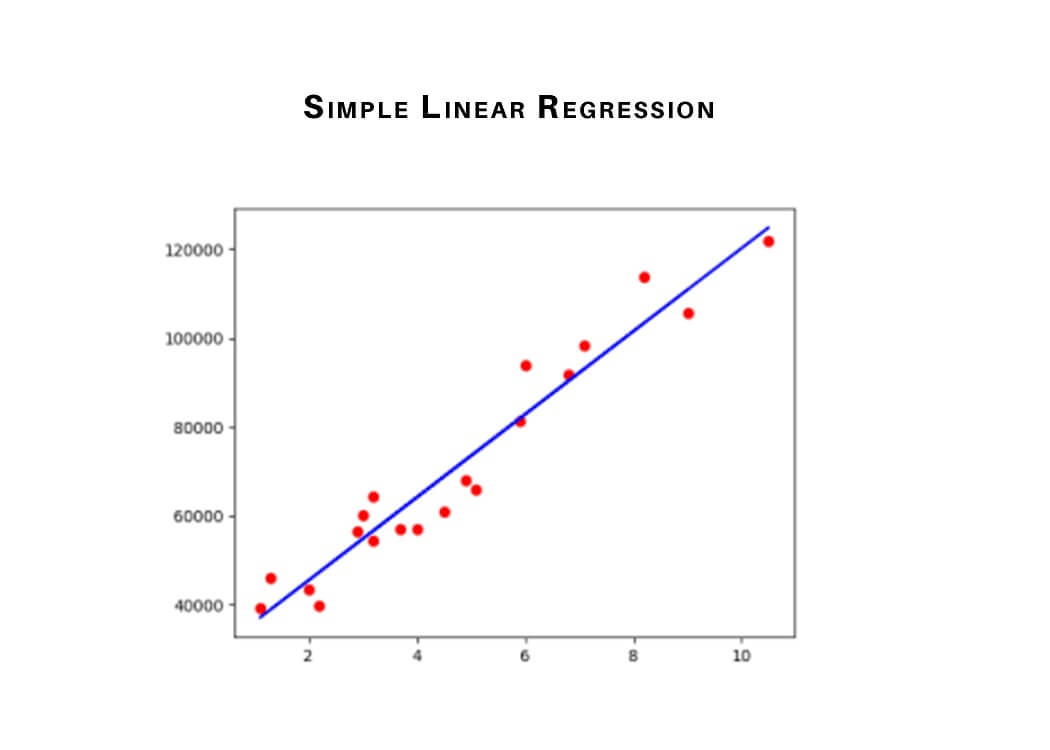
The best-fit decision boundary is determined by varying the values of m and c for different combinations. The difference between the observed values and the predicted value is called a predictor error. The values of m and c get selected to minimum predictor error.
Points to keep in mind:
- Note that a simple linear regression model is more susceptible to outliers hence; it should not be used in the case of big-size data.
- There should be a linear relationship between independent and dependent variables.
- There is only one independent and dependent variable.
- The type of regression line: a best fit straight line.
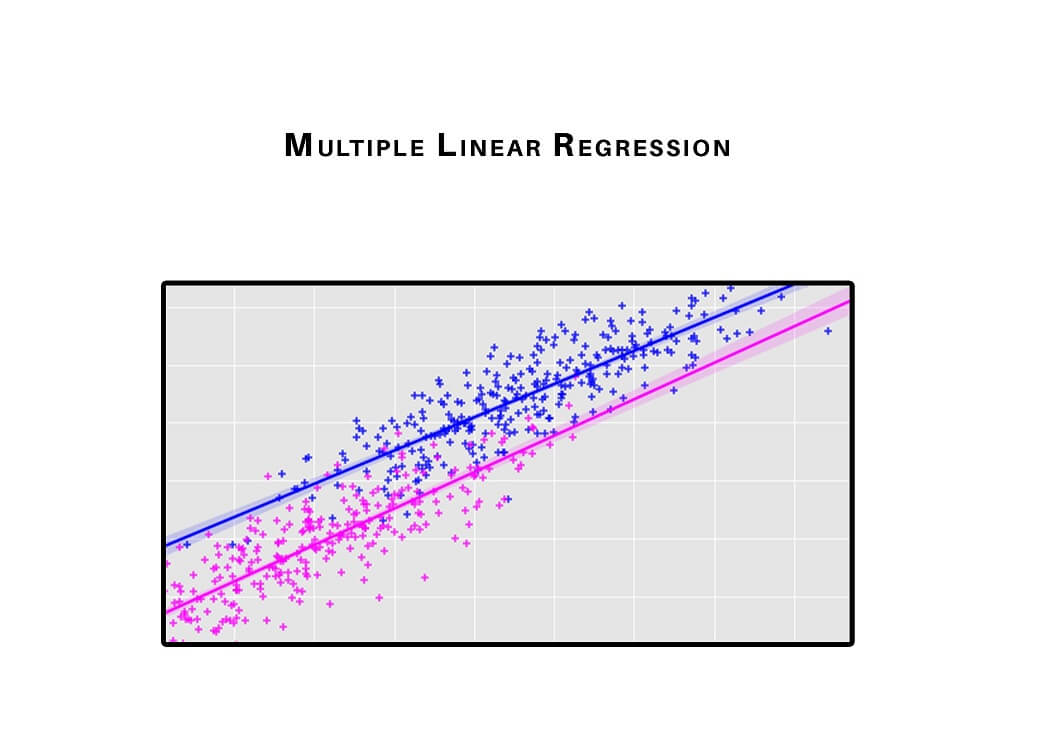
2) Multiple Linear Regression
Simple linear regression allows a data scientist or data analyst to make predictions about only one variable by training the model and predicting another variable. In a similar way, a multiple regression model extends to several more than one variable.
Simple linear regression uses the following linear function to predict the value of a target variable y, with independent variable x?.
y = b0 + b1x1
To minimize the square error we obtain the parameters b? and b? that best fits the data after fitting the linear equation to observed data.
Points to keep in mind:
- Multiple regression shows these features multicollinearity, autocorrelation, heteroscedasticity.
- Multicollinearity increases the variance of the coefficient estimates and makes the estimates very sensitive to minor changes in the model. As a result, the coefficient estimates are unstable.
- In the case of multiple independent variables, we can go with a forward selection, backward elimination, and stepwise approach for feature selection.
3) Polynomial Regression
In a polynomial regression, the power of the independent variable is more than 1. The equation below represents a polynomial equation:
y = a + bx2
In this regression technique, the best fit line is not a straight line. It is rather a curve that fits into the data points.
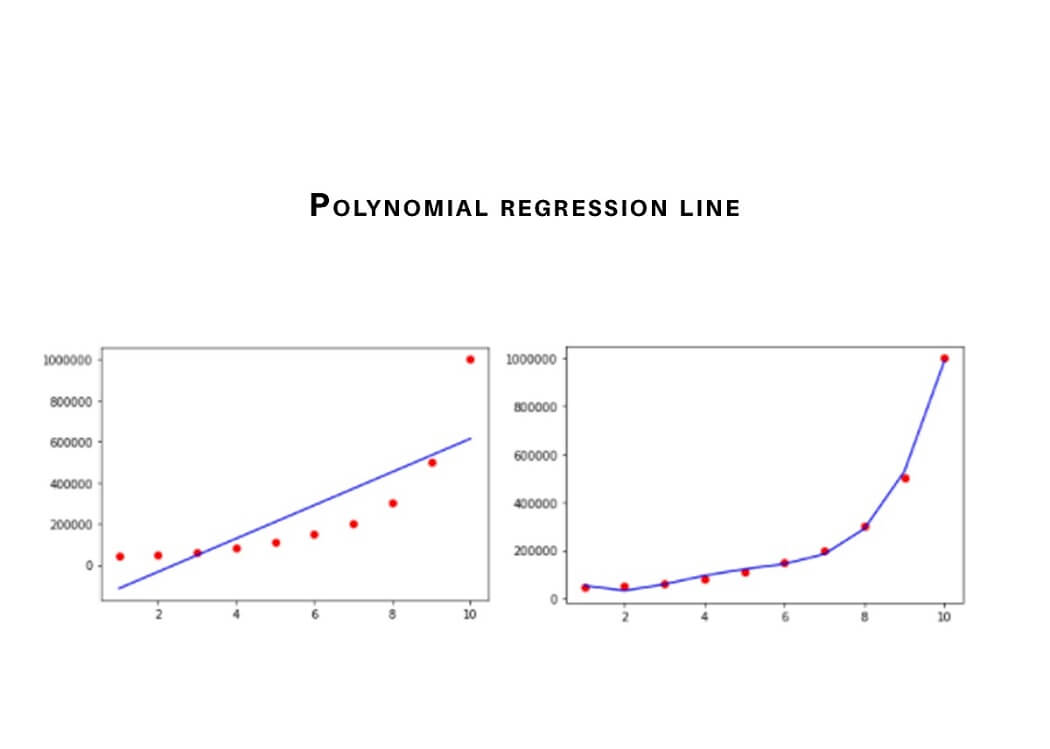
Points to keep in mind:
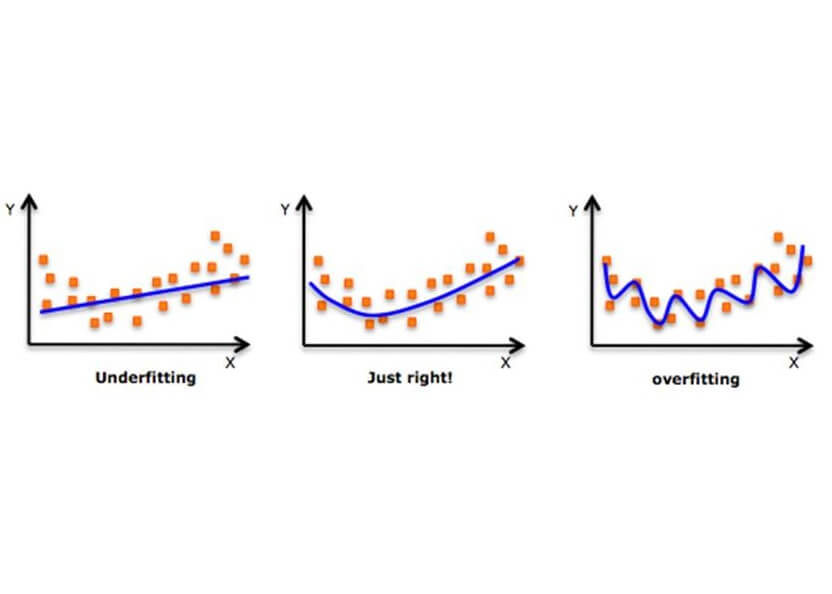
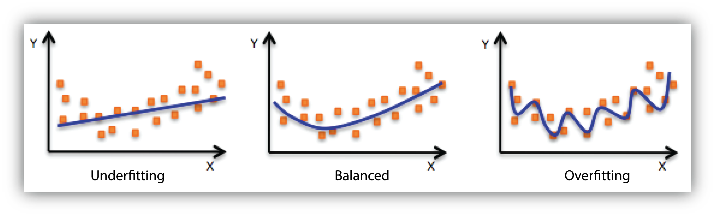
- In order to fit a higher degree polynomial to get a lower error, can result in overfitting. To plot the relationships to see the fit and focus to make sure that the curve fits according to the nature of the problem. Here is an example of how plotting can help:
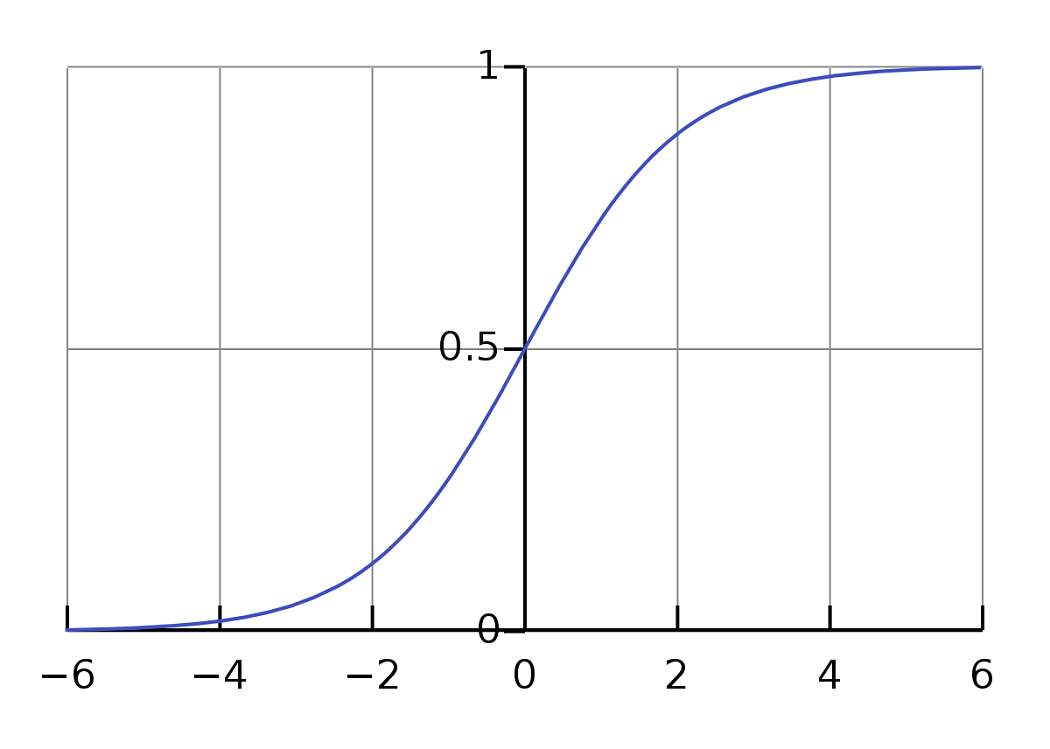
4) Logistic Regression
Logistic regression is a type of regression technique when the dependent variable is discrete. Example: 0 or 1, true or false, etc. This means the target variable can have only two values, and a sigmoid function shows the relation between the target variable and the independent variable.
The logistic function is used in Logistic Regression to create a relation between the target variable and independent variables. The below equation denotes the logistic regression.
here p is the probability of occurrence of the feature.
5) Ridge Regression
Ridge Regression is another type of regression in machine learning and is usually used when there is a high correlation between the parameters. This is because as the correlation increases the least square estimates give unbiased values. But if the collinearity is very high, there can be some bias value. Therefore, we introduce a bias matrix in the equation of Ridge Regression. It is a powerful regression method where the model is less susceptible to overfitting.
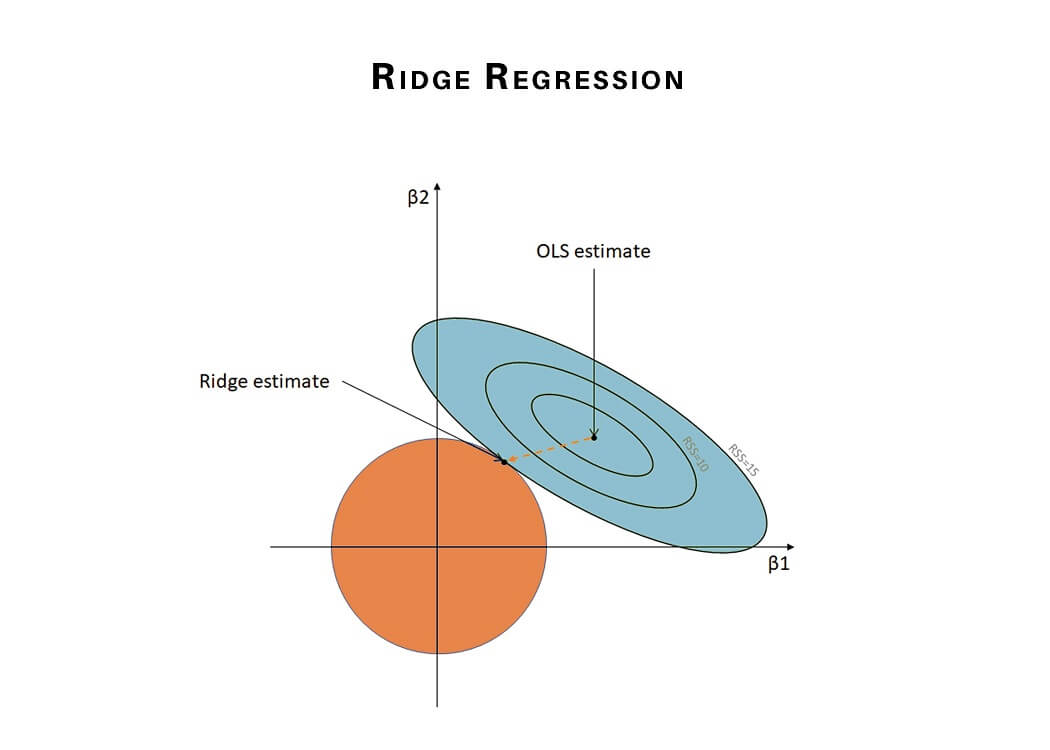
Below is the equation used to denote the Ridge Regression, λ (lambda) resolves the multicollinearity issue:
β = (X^{T}X + λ*I)^{-1}X^{T}y
6) Lasso Regression
Lasso Regression performs regularization along with feature selection. It avoids the absolute size of the regression coefficient. This results in the coefficient value getting nearer to zero, this property is different from what in ridge regression.
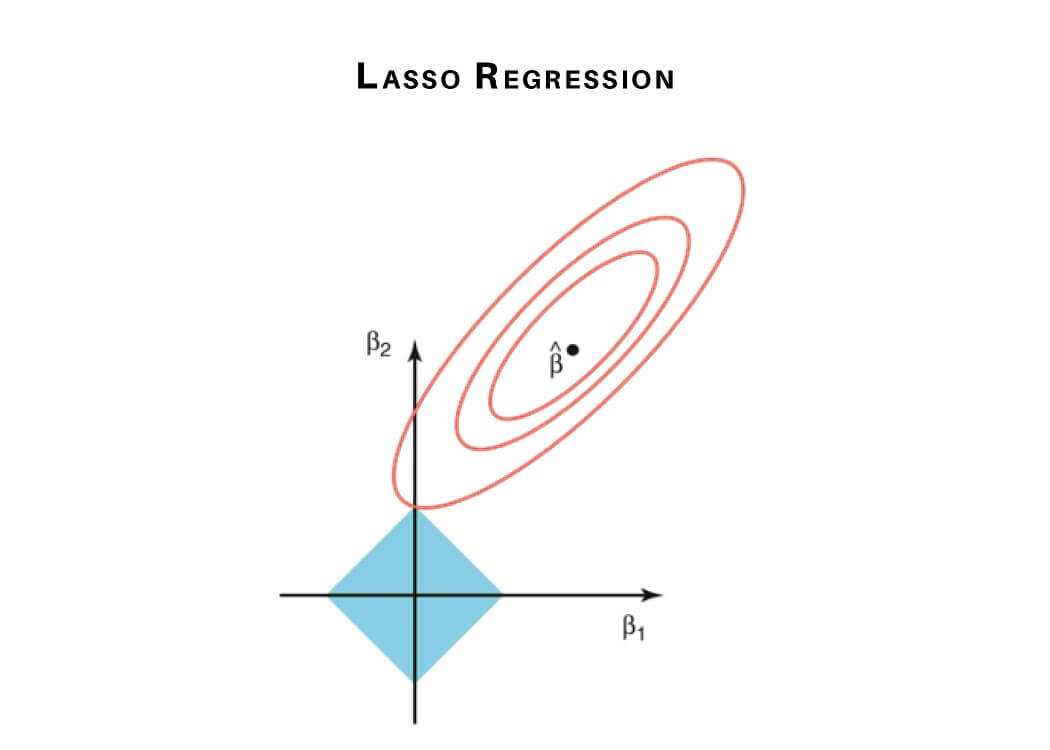
Therefore we use feature selection in Lasso Regression. In the case of Lasso Regression, only the required parameters are used, and the rest is made zero. This helps avoid the overfitting in the model. But if independent variables are highly collinear, then Lasso regression chooses only one variable and makes other variables reduce to zero. Below equation represents the Lasso Regression method:
N^{-1}Σ^{N}_{i=1}f(x_{i}, y_{I}, α, β)
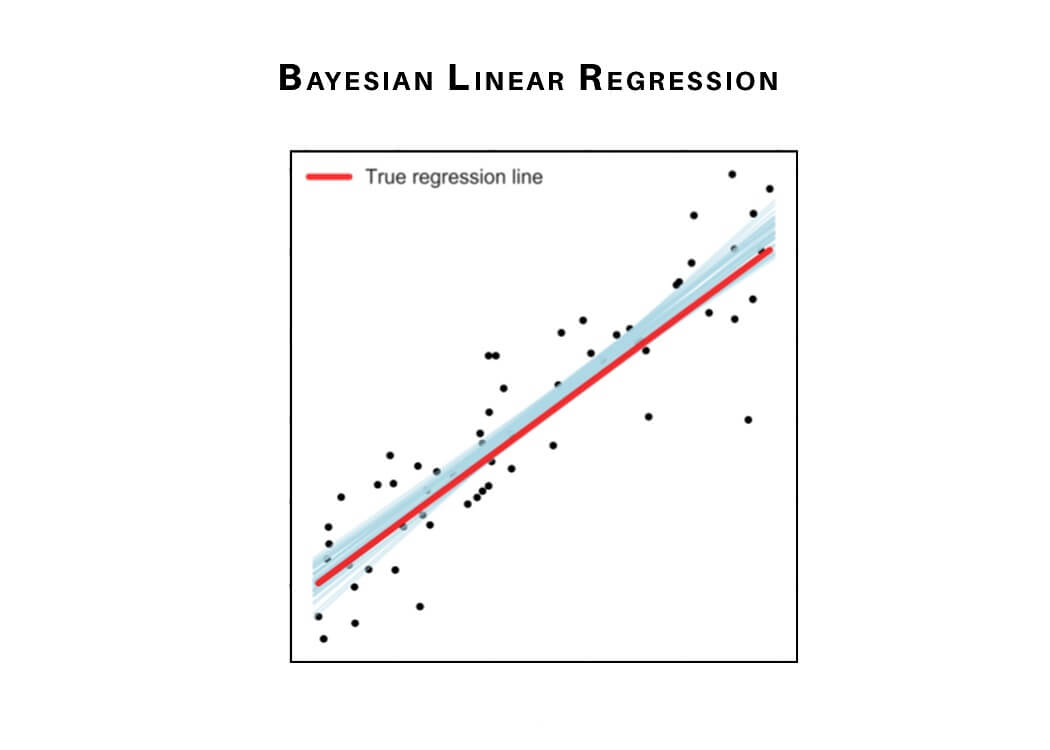
7) Bayesian Linear Regression
Bayesian Regression is used to find out the value of regression coefficients. In Bayesian linear regression, the posterior distribution of the features is determined instead of finding the least-squares. Bayesian Linear Regression is a combination of Linear Regression and Ridge Regression but is more stable than simple Linear Regression.
Now, we will learn some types of regression analysis which can be used to train regression models to create predictions with continuous values.
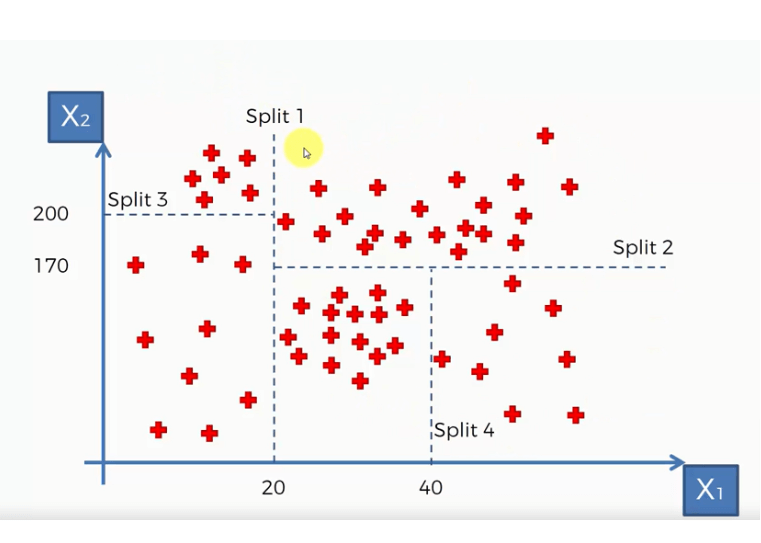
8) Decision Tree Regression
The decision tree as the name suggests works on the principle of conditions. It is efficient and has strong algorithms used for predictive analysis. It has mainly attributed that include internal nodes, branches, and a terminal node.
Every internal node holds a “test” on an attribute, branches hold the conclusion of the test and every leaf node means the class label. It is used for both classifications as well as regression which are both supervised learning algorithms. Decisions trees are extremely delicate to the information they are prepared on — little changes to the preparation set can bring about fundamentally different tree structures.
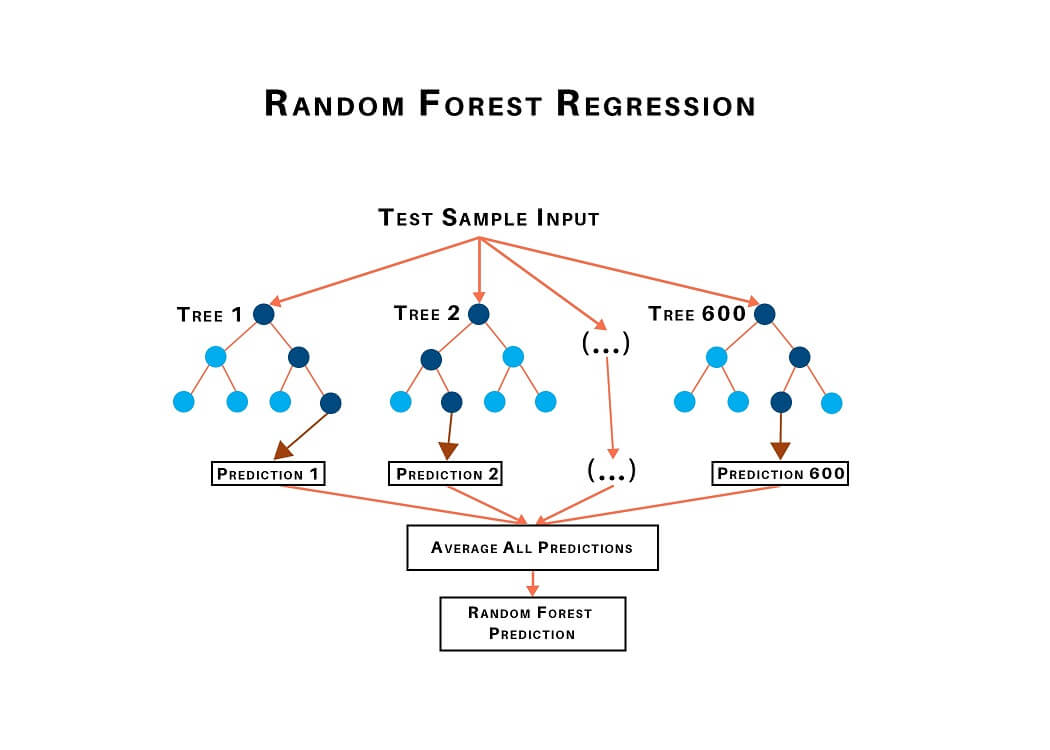
9) Random Forest Regression
Random forest, as its name suggests, comprises an enormous amount of individual decision trees that work as a group or as they say, an ensemble. Every individual decision tree in the random forest lets out a class prediction and the class with the most votes is considered as the model's prediction.
Random forest uses this by permitting every individual tree to randomly sample from the dataset with replacement, bringing about various trees. This is known as bagging.
How to select the right regression model?
Each type of regression model performs differently and the model efficiency depends on the data structure. Different types of algorithms help determine which parameters are necessary for creating predictions. There are a few methods to perform model selection.
- Adjusted R-squared and predicted R-square: The models with larger adjusted and predicted R-squared values are more efficient. These statistics can help you avoid the fundamental problem with regular R-squared—it always increases when you add an independent variable. This property can lead to more complex models, which can sometimes produce misleading results.
-
- Adjusted R-squared increases when a new parameter improves the model. Low-quality parameters can decrease model efficiency.
- Predicted R-squared is a cross-validation method that can also decrease the model accuracy. Cross-validation partitions the data to determine whether the model is a generic model for the dataset.
- P-values for the independent variables: In regression, smaller p-values than significance level indicate that the hypothesis is statistically significant. “Reducing the model” is the process of including all the parameters in the model, and then repeatedly removing the term with the highest non-significant p-value until the model contains only significant weighted terms.
- Stepwise regression and Best subsets regression: The two algorithms that we discussed for automated model selection that pick the independent variables to include in the regression equation. When we have a huge amount of independent variables and require a variable selection process, these automated methods can be very helpful.
Conclusion
The different types of regression analysis in data science and machine learning discussed in this tutorial can be used to build the model depending upon the structure of the training data in order to achieve optimum model accuracy.
I hope the tutorial helps you get a clearer picture of the regression algorithms and their application. Happy learning :)


