In data analysis and statistics, percentiles play a crucial role in assessing and interpreting data distributions. In this article, we will look at the concept of percentiles in the R programming language, including how to calculate percentile ranks, plot percentiles, and determine the percentile of a column in a dataset.
What are Percentiles?
Percentiles are statistical measurements that classify data into particular percentage groupings. These groupings help in determining the distribution of values within the dataset. For example, the 25th percentile (also known as the first quartile) is the value below which 25% of the data falls.
The quantile() function is commonly used to calculate percentiles. Let's start by exploring how to calculate the percentile rank in R.
Calculating Percentile Rank in R
The percentile rank of a value in a dataset is the percentage of values in the dataset that are less than or equal to that value. The quantile() function in R can be used to calculate the percentile rank.
Let us consider the following example which contain a dataset of exam scores.
Code:
scores <- c(75, 82, 90, 65, 88, 72, 95, 60, 78, 85)

percentile_75 <- quantile(scores, 0.75)

percentile_rank_80 <- sum(scores <= 80) / length(scores) * 100

cat("75th Percentile:", percentile_75, "\n")
cat("Percentile Rank of 80:", percentile_rank_80, "%\n")
Output:
75th Percentile: 87.25

Percentile Rank of 80: 50 %
In this example, the quantile() function calculates the 75th percentile of exam scores. In addition, we manually determine a single value's percentile rank (80) by calculating the number of values less than or equal to 80 and dividing it by the total number of values.
Plotting Percentiles in R
Visualizing percentiles might help you better grasp the data distribution. In R, we can use the boxplot() function from the base graphics package to generate a boxplot that displays the percentile of our dataset.
Code:
boxplot(scores, main = "Boxplot of Exam Scores", ylab = "Score")

quantiles <- quantile(scores, probs = c(0.1, 0.9))
abline(h = quantiles, col = "gray", lty = 3)

text(x = 1.2, y = quantiles, labels = c("10th Percentile", "90th Percentile"), pos = 4)
Plot:
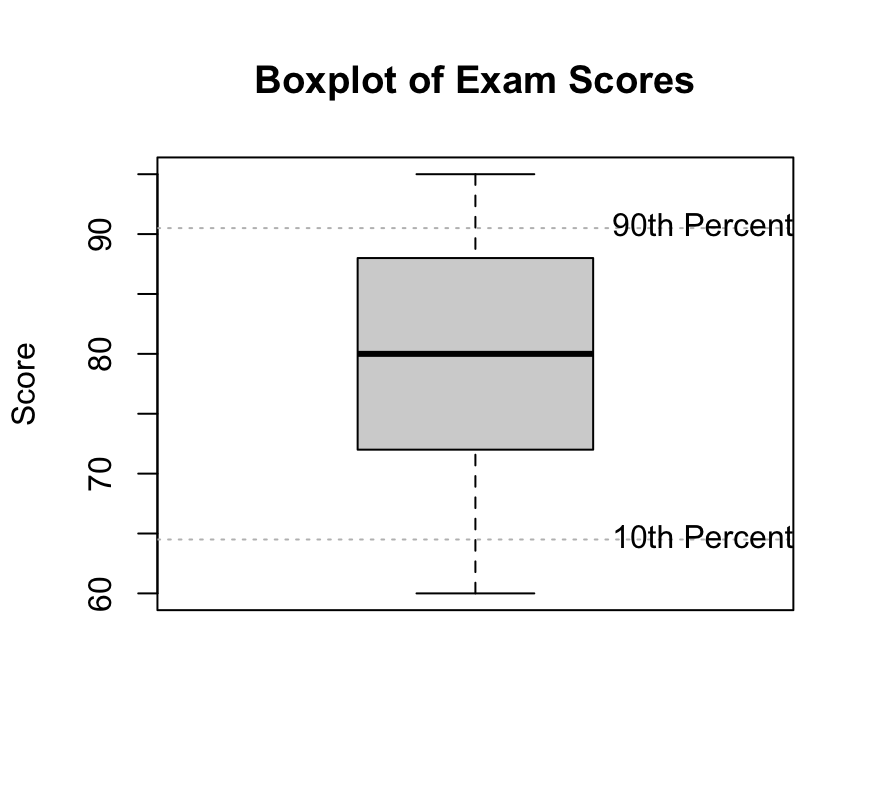
In this example, we use the basic boxplot() function in R programming to plot the boxplot of the dataset with different percentiles represented in them.
Calculating Percentile of a Column in R
When working with datasets, it's common to calculate percentiles for specific columns. The quantile() function can be applied to individual columns of a dataframe to calculate column-wise percentiles.
Let us look at the following example with a dataframe containing multiple columns.
Code:
data <- data.frame(
  Name = c("Ashley", "Bobby", "Charles", "Dave", "Emily"),
  Math_Score = c(75, 82, 90, 65, 88),
  English_Score = c(72, 85, 78, 95, 60)
)

math_percentile_25 <- quantile(data$Math_Score, 0.25)

english_percentile_50 <- quantile(data$English_Score, 0.50)

cat("25th Percentile for Math_Score:", math_percentile_25, "\n")
cat("50th Percentile for English_Score:", english_percentile_50, "\n")
Output:
25th Percentile for Math_Score: 75

50th Percentile for English_Score: 78
In this example, we use the quantile() method to compute percentiles for particular columns (Math_Score and English_Score) in the dataframe. The generated percentiles provide information about the distribution of scores within each subject.
Plotting Multiple Percentiles in R
To gain a detailed view distribution of the dataset we created, we can visualize multiple percentiles simultaneously. The boxplot() function in R is commonly used for this purpose.
Let's now create a boxplot to visualize the distribution of scores in both Math and English subjects.
Code:
boxplot(data[, c("Math_Score", "English_Score")], col = c("orange", "green"),
        main = "Boxplot of Math and English Scores",
        xlab = "Subjects", ylab = "Scores")
Plot:
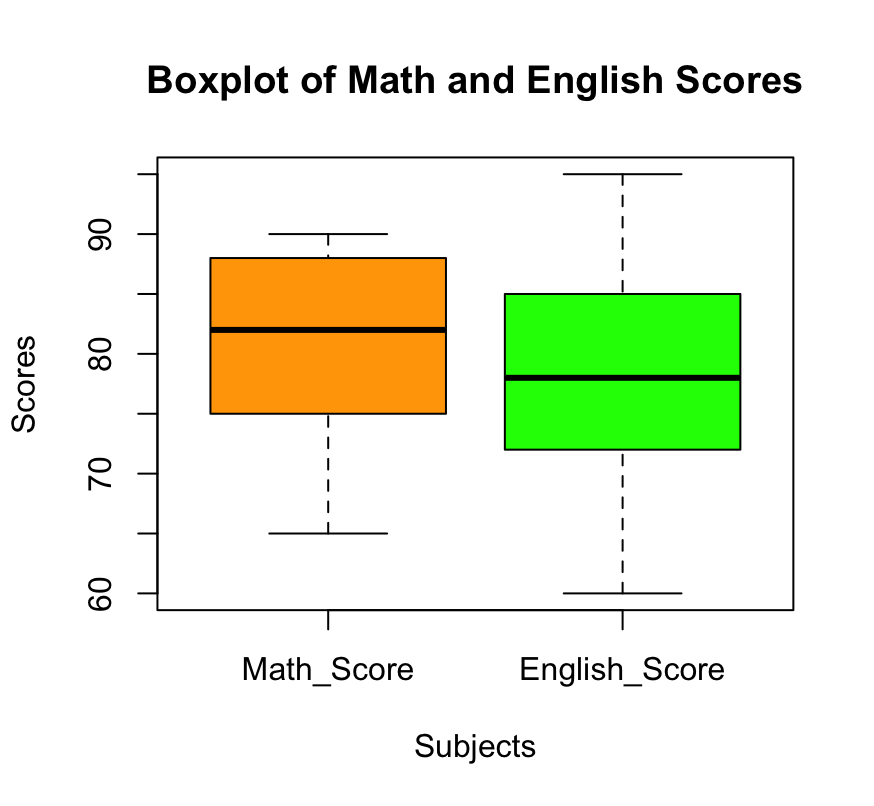
In this example, we use the boxplot() function is used to create a boxplot comparing the distributions of scores in Math and English subjects. The boxplot provides a visual representation of the median, quartiles, and potential outliers in each subject.
Advanced Percentile Calculations in R
For more advanced percentile calculations, we use the quantile() function to provide multiple quantiles at once. Furthermore, using the summary() function we get a summary of several percentiles.
Code:
percentiles <- c(0.25, 0.50, 0.75)
summary_stats <- summary(data$Math_Score, quantiles = percentiles)

cat("Summary Statistics for Math_Score:\n")
print(summary_stats)
Output:
Summary Statistics for Math_Score:

   Min. 1st Qu.  Median    Mean 3rd Qu.    Max.
     65      75      82      80      88      90
In this example, the summary() function's quantiles option is used to define multiple percentiles (25th, 50th, and 75th). The summary gives output, defining a clear picture of the Math_Score column's distribution.
Conclusion
Percentiles in R provide useful insights into data distribution, allowing data analysts and statisticians to comprehend a dataset's properties better. From computing percentile ranks to plotting percentiles, R's capabilities and functions make it an effective platform for percentile analysis. Whether you're analyzing exam scores, financial data, or any other information, understanding percentiles in R can help you draw meaningful conclusions and make informed decisions based on the underlying data distribution.