When working with matrixes in R, you must learn how to sweep row and column-wise. In this article, we will look at the sweep() function in detail along with its use cases.
What is the sweep() Function in R?
Imagine you have a huge table containing information about a list of people. Now, you want to do something for each individual. Row-wise calculations can neatly do this. Similarly, if you want to look at one characteristic for everyone and see how it varies, column-wise operations can be useful. The sweep() function is a way to perform these kinds of operations.
The sweep() function in R is used to perform mathematical operations or custom functions across either rows or columns of a matrix/dataframe. It lets you apply the operation to each element in a specific direction (row-wise or column-wise), thereby making it easier to manipulate and analyze data.
This function helps you avoid complicated loops and provides a vectorized, efficient, and readable approach to data manipulation. This is especially useful for the tasks of preprocessing, centering, and scaling variables.
The syntax of the sweep() function is as follows:
sweep(x, MARGIN, STATS, FUN, ...)
Here are the parameters:
- x: The array, matrix, or dataframe on which the operation is to be performed.
- MARGIN: The margin on which the function should be applied (1 for rows, 2 for columns, c(1, 2) for both)
- STATS: An array, matrix, or dataframe with values to use in the function. Its dimensions must match those of x.
- FUN: The function to be used. It can either be a mathematical operation or a custom function.
- ... denotes Additional arguments to be passed to the function specified by FUN.
Let’s see an example of the same:
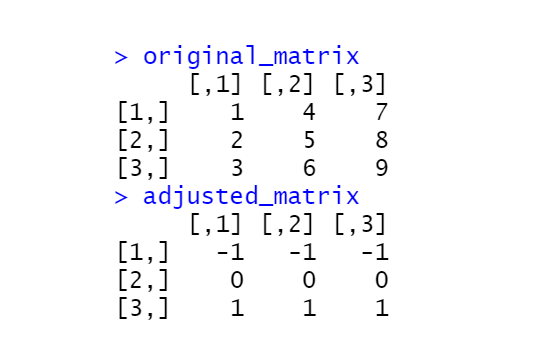
# Generate a matrix
original_matrix <- matrix(1:9, nrow = 3)

# Subtract the column mean for elements in the respective column
adjusted_matrix <- sweep(original_matrix, MARGIN = 2, STATS = colMeans(original_matrix), FUN = "-")

original_matrix
adjusted_matrix
Output:
Use Cases of sweep function
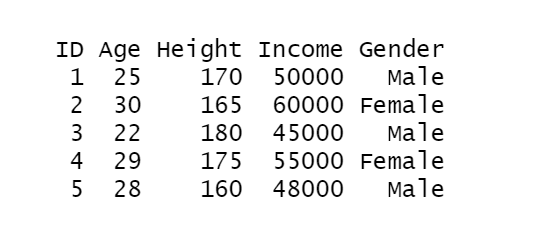
First, let’s take a sample dataframe:
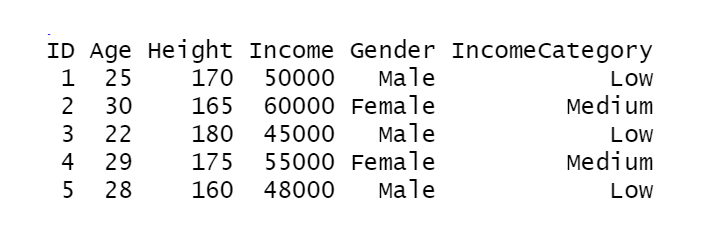
# Create a sample data frame
set.seed(123)
sample_data <- data.frame(
  ID = 1:5,
  Age = c(25, 30, 22, 29, 28),
  Height = c(170, 165, 180, 175, 160),
  Income = c(50000, 60000, 45000, 55000, 48000),
  Gender = c("Male", "Female", "Male", "Female", "Male")
)
sample_data
Output:

The sweep() function is most commonly used for the following scenarios:
1) Element-wise Arithmetic Operations
This means to perform arithmetic operations on each element in the data frame. It is useful for simple adjustments or calculations. Check the example below:
# Add 5000 to everyone’s income
sample_data[["Income"]] <- sweep(sample_data[, "Income", drop = FALSE], MARGIN = 2, STATS = 5000, FUN = "+")
Output:
2) Centering and Scaling
Centering is to shift the values of a variable so that the mean becomes 0. This is done by subtracting the variable’s mean from each value. Scaling is to adjust the spread of the variable, which is done by dividing the value by its standard deviation. Scaling is important when variables have different ranges, to prevent one variable from dominating the analysis because of its larger values.
Here is the code:
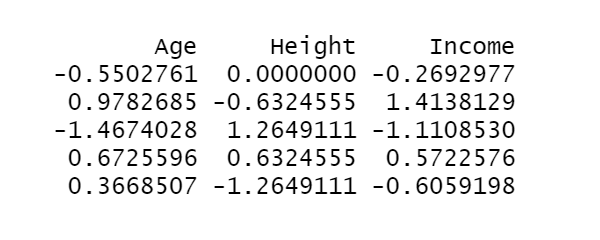
# Center the variables
centered_scaled_data <- sweep(sample_data[, c("Age", "Height", "Income")], MARGIN = 2, STATS = colMeans(sample_data[, c("Age", "Height", "Income")], na.rm = TRUE), FUN = "-")

# Scale the variables
centered_scaled_data <- sweep(centered_scaled_data, MARGIN = 2, STATS = apply(sample_data[, c("Age", "Height", "Income")], 2, sd, na.rm = TRUE), FUN = "/")
Output:
3) Recoding and Recategorizing
This is to change the values or categories of a variable. It simplifies analysis and handles outliers. Check the example below:
# Define breaks for recording
breaks <- c(-Inf, 50000, 60000, Inf)

# Recode "Income" into categories using sweep
recoded_data <- sweep(sample_data$Income, MARGIN = 2, STATS = breaks, FUN = cut, labels = c("Low", "Medium", "High"), include.lowest = TRUE)

# Convert the result to a data frame
recoded_data <- as.data.frame(recoded_data)
Output:
4) Custom Functions
Sweep() can also be used with user-defined functions. Here’s an example:
# Define a custom function
custom_function <- function(x, multiplier = 1, ...) {
  result <- x * multiplier
  return(result)
}
# Choose a column to apply the custom function
column_to_apply <- "Income"
# Apply the custom function using sweep
sample_data[[column_to_apply]] <- sweep(sample_data[[column_to_apply]], MARGIN = 2, STATS = 2, FUN = custom_function, multiplier = 1.5)
Output:

When to use sweep() in R?
Sweep() is efficient for element-wise operations across rows or columns. Its in-place modification minimizes memory overhead. It is also versatile for various mathematical operations. However, it is limited to element-wise operations and might not be suitable for complex operations. It also may not be the most efficient option for large datasets or intricate computations.
Conclusion
In a nutshell, the sweep function in R is efficient for simple arithmetic operations, centering, scaling, or applying custom functions element-wise. However, for more complex operations or large datasets, it may not be the most efficient choice, and alternative approaches should be considered for optimal performance.