

 By Shivali Bhadaniya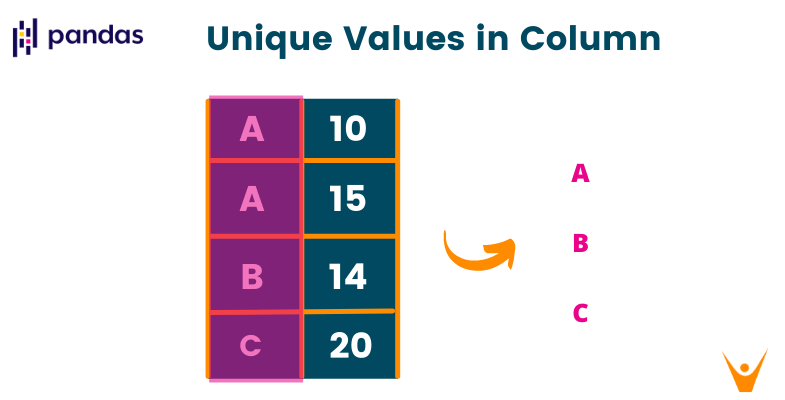
In pandas, you get the unique values in a column with the unique() method: df["column"].unique() returns each distinct value once, as a NumPy array, in order of first appearance.
Related tools cover the neighboring tasks: drop_duplicates() keeps the result as a Series, nunique() counts the distinct values, and value_counts() counts how often each one appears. This lesson shows all of them on one DataFrame.
How Do You Get Unique Values in a Column?
Call unique() on the column, and it returns an array of the distinct values.
import pandas as pd

df = pd.DataFrame({"city": ["delhi", "oslo", "delhi", "lima", "oslo"]})
print(df["city"].unique())  # Outputs: ['delhi' 'oslo' 'lima']
The result is a NumPy array, not a list, and the values keep the order in which they first appear in the column.

3 Ways to Get Distinct Values From a Column
1) The unique() Method
unique() is the direct method on a Series. It runs in O(n) time using a hash table, so the values do not need to be sorted first.
import pandas as pd

orders = pd.DataFrame({"status": ["shipped", "pending", "shipped", "returned"]})
print(orders["status"].unique())  # Outputs: ['shipped' 'pending' 'returned']
2) The drop_duplicates() Method
drop_duplicates() returns a Series instead of an array, keeping the original index and dtype. Chain pandas methods on this result.
import pandas as pd

orders = pd.DataFrame({"status": ["shipped", "pending", "shipped", "returned"]})
print(orders["status"].drop_duplicates())
# Outputs:
# 0     shipped
# 1     pending
# 3    returned
# Name: status, dtype: object
3) The pd.unique() Function
The top-level pd.unique() function does the same job and also accepts any array-like input, not just a Series.
import pandas as pd

print(pd.unique(["usd", "eur", "usd", "inr"]))  # Outputs: ['usd' 'eur' 'inr']
How to Count Unique Values in a Column
nunique() returns how many distinct values a column has, and value_counts() returns each value with its frequency, sorted from most to least common. Both skip NaN by default.
import pandas as pd

df = pd.DataFrame({"plan": ["free", "pro", "free", "team", "free"]})
print(df["plan"].nunique())  # Outputs: 3
print(df["plan"].value_counts())
# Outputs:
# plan
# free    3
# pro     1
# team    1
# Name: count, dtype: int64
Unique Values Across Multiple Columns
Calling drop_duplicates() on the whole DataFrame returns the distinct rows for the selected columns, which is the pandas version of SQL's SELECT DISTINCT.
import pandas as pd

sales = pd.DataFrame({
    "region": ["east", "east", "west"],
    "product": ["chair", "chair", "desk"],
})
print(sales[["region", "product"]].drop_duplicates())
# Outputs:
#   region product
# 0   east   chair
# 2   west    desk
To collect the unique values of every column separately, loop with unique() per column.
How NaN Values Are Handled
unique() includes NaN as one of the distinct values, while nunique() and value_counts() drop it unless you pass dropna=False.
import pandas as pd
import numpy as np

df = pd.DataFrame({"grade": ["a", np.nan, "b", "a"]})
print(df["grade"].unique())   # Outputs: ['a' nan 'b']
print(df["grade"].nunique())  # Outputs: 2
When to Use Each Method
| Method | Returns | Use it when |
|---|---|---|
unique() | NumPy array | You just need the distinct values |
drop_duplicates() | Series or DataFrame | You keep working in pandas, or need distinct rows |
nunique() | Integer | You only need how many distinct values exist |
value_counts() | Series of frequencies | You need how often each value appears |

Examples of Getting Unique Values
1) Printing the Unique Values as a List
tolist() converts the array into a plain Python list for printing or JSON output.
import pandas as pd

df = pd.DataFrame({"tag": ["python", "sql", "python", "excel"]})
print(df["tag"].unique().tolist())  # Outputs: ['python', 'sql', 'excel']
2) Sorted Unique Values
import pandas as pd

df = pd.DataFrame({"size": ["m", "s", "xl", "s", "l"]})
print(sorted(df["size"].unique()))  # Outputs: ['l', 'm', 's', 'xl']
3) Unique Customers Per Region
Combined with groupby, nunique() counts distinct values inside each group.
import pandas as pd

visits = pd.DataFrame({
    "region": ["east", "east", "west", "east"],
    "customer": ["[email protected]", "[email protected]", "[email protected]", "[email protected]"],
})
print(visits.groupby("region")["customer"].nunique())
# Outputs:
# region
# east    2
# west    1
# Name: customer, dtype: int64
Learn More About Unique Values in Pandas
The pandas unique() Documentation Behavior
Per the pandas documentation, unique() returns values in order of appearance and does not sort. Uniques of a categorical column come back as a Categorical, and datetimes keep their type. String columns hash slower than numeric ones, but the scan is still one pass.
unique() vs value_counts()
unique() answers "which values exist" and value_counts() answers "how often does each appear". If you find yourself calling unique() and then counting, one value_counts() call does both.
Filtering With the Unique Values
The result of unique() works directly with isin() to filter another DataFrame: other[other["city"].isin(df["city"].unique())].
Key Takeaways for Pandas Unique Values
- unique() - distinct values of a column as a NumPy array, in order of first appearance, O(n) time.
- drop_duplicates() - the same values as a Series, or distinct rows when called on a DataFrame.
- nunique() - the count of distinct values, skipping
NaNby default. - value_counts() - each distinct value with its frequency, most common first.
- NaN - appears in
unique()but is dropped by the counting methods unlessdropna=False.
Counting distinct values per group is one step away from full aggregation. Read our lesson on pandas groupby count to summarize a DataFrame by group.