

 By Shivali Bhadaniya
In pandas, the standard way to count rows per group is df.groupby("column").size(). The related count() method also counts per group, but it skips missing values and counts each column separately.
Which one you want depends on the question: "how many rows are in each group" is a size() question, and "how many non-null values does each column have per group" is a count() question.
How Do You Count Rows per Group in Pandas?
Group the DataFrame by a column and call size(). The result is a Series with one row count per group:
import pandas as pd

df = pd.DataFrame({
    "city": ["delhi", "mumbai", "delhi", "goa", "delhi"],
    "order_id": [101, 102, 103, 104, 105],
})

print(df.groupby("city").size())
# Outputs:
# city
# delhi     3
# goa       1
# mumbai    1
# dtype: int64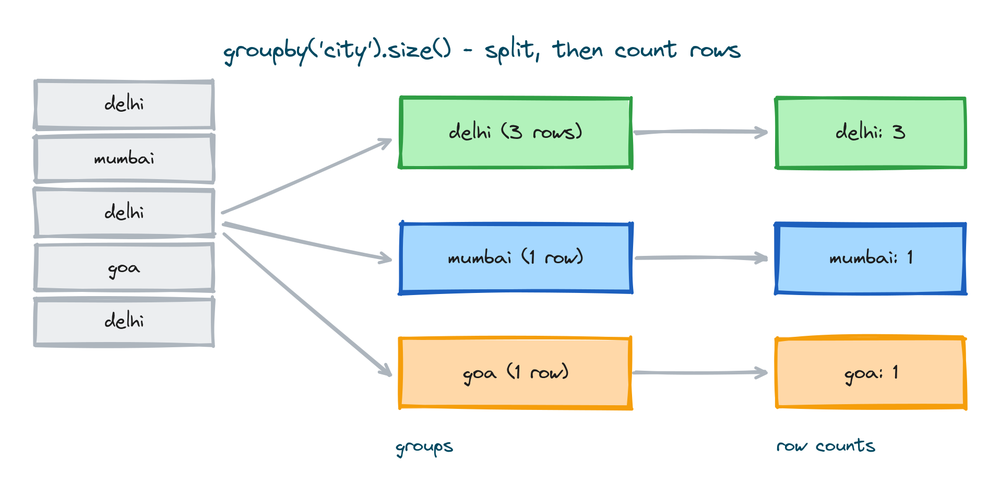
5 Ways to Count with Pandas Groupby
1) groupby().size()
size() counts every row in each group, including rows with missing values, and returns one number per group:
print(df.groupby("city").size())
# Outputs:
# city
# delhi     3
# goa       1
# mumbai    1
# dtype: int64
2) groupby().count()
count() counts the non-null values of every other column, group by group, and returns a DataFrame with one column per counted column:
print(df.groupby("city").count())
# Outputs:
#         order_id
# city
# delhi          3
# goa            1
# mumbai         1
3) value_counts()
When all you need is how often each value appears in one column, value_counts() does the group-and-count in a single call and sorts the result largest first:
print(df["city"].value_counts())
# Outputs:
# city
# delhi     3
# mumbai    1
# goa       1
# Name: count, dtype: int64
4) groupby().agg()
agg() counts as part of a larger aggregation, and named aggregation lets you name the output column at the same time:
result = df.groupby("city").agg(orders=("order_id", "count"))
print(result)
# Outputs:
#         orders
# city
# delhi        3
# goa          1
# mumbai       1
5) groupby().transform()
transform("count") returns the group count aligned to every original row, which is how you add a count column to the DataFrame without collapsing it:
df["city_orders"] = df.groupby("city")["order_id"].transform("count")
print(df)
# Outputs:
#      city  order_id  city_orders
# 0   delhi       101            3
# 1  mumbai       102            1
# 2   delhi       103            3
# 3     goa       104            1
# 4   delhi       105            3
Pandas Groupby Count vs Size
The two methods disagree the moment a group contains missing values. size() counts rows, count() counts non-null values:
import pandas as pd
import numpy as np

df = pd.DataFrame({
    "city": ["delhi", "delhi", "mumbai"],
    "rating": [4.5, np.nan, 4.0],
})

print(df.groupby("city").size())
# Outputs:
# city
# delhi     2
# mumbai    1
# dtype: int64

print(df.groupby("city")["rating"].count())
# Outputs:
# city
# delhi     1
# mumbai    1
# Name: rating, dtype: int64
Delhi has two rows but only one rating, so size() says 2 and count() says 1. The other differences:
| size() | count() | |
|---|---|---|
| Missing values (NaN) | Included | Excluded |
| Return type | Series, one number per group | DataFrame, one column per counted column |
| Question it answers | How many rows per group | How many non-null values per column per group |
Naming the Count Column
size() returns a Series with the group labels in the index. reset_index(name="count") turns it into a tidy DataFrame with a named column, which is the usual shape for further processing or plotting:
counts = df.groupby("city").size().reset_index(name="count")
print(counts)
# Outputs:
#      city  count
# 0   delhi      2
# 1  mumbai      1
Examples of Counting with Groupby
1) Counting Orders per City, Sorted
Chaining sort_values() ranks the groups by their count:
import pandas as pd

orders = pd.DataFrame({
    "city": ["delhi", "mumbai", "delhi", "goa", "delhi", "mumbai"],
    "amount": [250, 480, 120, 900, 330, 610],
})

top = orders.groupby("city").size().sort_values(ascending=False)
print(top)
# Outputs:
# city
# delhi     3
# mumbai    2
# goa       1
# dtype: int64
2) Counting Unique Values per Group
nunique() counts distinct values instead of all values, such as how many different cities each customer ordered from:
import pandas as pd

orders = pd.DataFrame({
    "customer": ["riya", "riya", "sam", "riya"],
    "city": ["delhi", "delhi", "mumbai", "goa"],
})

print(orders.groupby("customer")["city"].nunique())
# Outputs:
# customer
# riya    2
# sam     1
# Name: city, dtype: int64
Learn More About Counting in Pandas
Counting All Rows in a DataFrame
Without grouping, len(df) returns the total row count, and df.shape returns rows and columns together. df.count() without a groupby gives per-column non-null counts, following the same NaN rule as its groupby version:
print(len(orders))    # Outputs: 4
print(orders.shape)   # Outputs: (4, 2)
Counting Multiple Group Keys
Passing a list of columns groups by their combinations, which counts each pair once per occurrence:
print(orders.groupby(["customer", "city"]).size())
# Outputs:
# customer  city
# riya      delhi     2
#           goa       1
# sam       mumbai    1
# dtype: int64
Key Takeaways for Pandas Groupby Count
- Rows per group is
size()- It counts every row, including rows with missing values. - Non-null values is
count()- It skips NaN and reports each column separately. - One column's frequencies is
value_counts()- Group, count, and sort in a single call. - Name the output -
size().reset_index(name="count")gives a tidy DataFrame. - Keep every row -
transform("count")aligns the counts back onto the original DataFrame. - Distinct values is
nunique()- Use it when duplicates should count once.
Counting how many values fall in each group usually leads to asking which values they are. The pandas unique values lesson covers exactly that.