Statistical hypothesis testing is a method that uses samples from populations to estimate the parameters of those populations. In this article, we will learn how to perform a Paired Sample T-test in R.
What is a Paired Sample T-Test?
While analyzing different groups for research, regular comparisons often miss the mark because people or things are naturally different. So we don't know if the difference is due to the test subjects or the test.
A paired t-test accounts for these inherent differences. By focusing on changes within the same group, it reveals if something like a new medicine truly has an effect, beyond just normal variations.
The t-test is one such inferential statistical method used to analyze how groups and populations are related. The three different kinds of t-tests are:
- One-sample compares the mean of a sample to the known mean of a population.
- Two-sample compares the means of two independent groups.
- Paired sample It compares the means of two related groups (like the before-and-after).
A paired sample t-test is a way to check if there's a difference between two things measured in the same group. It tells you if this difference is real or just random.
You can perform this test mathematically by following these steps:
- Null Hypothesis (H0): It states that the true mean difference between paired samples (μd) is 0.
- Alternative Hypothesis (H1): It states that μd is not 0. It is upper-tailed if μd > 0 and lower-tailed if μd < 0.
- Test Statistic: We can find the value of t in the following way:
First, subtract the first measurement from the second for each pair (di). This is the difference between the two paired samples. For this, find the mean and the standard deviation.
Now, calculate the test statistic.
t= mean / (standard deviation / √n)
where n is the number of observations in the two samples
Level of Significance (α): It is a measure of confidence required for the model to make a decision. By default, it is 0.05. This means that the likelihood of rejecting H0 when it is incorrect is 5%.
p-value: This is the probability of getting a value as extreme as our test statistic under the null hypothesis. We can find Pr from the t-distribution table at value t and degrees of freedom (n-1). Now, if X is a random variable following t-distribution: p = 2*Pr(X > |t|) for two-tailed. p = Pr(X > t) for upper-tailed and p = Pr(X < t) for lower-tailed.
Decision: If p is lesser than or equal to α, the null hypothesis is rejected and the alternative hypothesis is accepted. Otherwise, the null hypothesis is accepted.
A paired sample t-test is useful when you measure the same thing in the same group twice. It works well when the populations follow the below assumptions.
Paired sample t-test makes some assumptions to ensure that the results are accurate. These are:
- The dependent variable must be continuous.
- The observations are independent of one another.
- The dependent variable should be approximately normally distributed.
- The dependent variable should not contain any outliers.
Paired Sample t-test in R
The t.test() function is used to perform the paired sample t-test in R. Its syntax is as follows:
t.test(x, y, alternative, mu, paired, var.equal, conf.level)
Parameters:
- x: Data for the first group.
- y: Data for the second group.
- alternative: The alternative hypothesis. Available options are:
- two.sided - the default option
- less - for a one-tailed test in the direction of less than
- greater - for a one-tailed test in the direction of greater than
- mu: The difference between the means in the null hypothesis (default is 0).
- paired: Boolean that decides whether the t-test is paired (default is FALSE).
- var.equal: Boolean that decides whether we can assume that the variances are equal (default is FALSE). When False, the test calculates variances separately and adjusts the degrees of freedom.
- conf.level: The confidence level (default is 0.95). The level of significance is given as (1 - confidence level).
To use this function in R, let’s take the built-in “sleep” dataset. This shows the effect of two drugs on the sleep quality of 10 people. The Paired Sample T-test is conducted to determine if there’s a significant difference in sleep quality between the two groups.
The sleep dataset has 3 columns:
- Extra: increase in hours of sleep compared to control
- Group: the drug given
- ID: the ID of the person (each ID appears twice)
Let's now look at an example:
# Load the sleep dataset
data(sleep)

# Preview the dataset
sleep
Output:
   extra group ID
1    0.7     1  1
2   -1.6     1  2
3   -0.2     1  3
4   -1.2     1  4
5   -0.1     1  5
6    3.4     1  6
7    3.7     1  7
8    0.8     1  8
9    0.0     1  9
10   2.0     1 10
11   1.9     2  1
12   0.8     2  2
13   1.1     2  3
14   0.1     2  4
15  -0.1     2  5
16   4.4     2  6
17   5.5     2  7
18   1.6     2  8
19   4.6     2  9
20   3.4     2 10
Let's now do this:
# Calculate the mean difference in sleep quality

mean_sleep<- tapply(sleep$extra, sleep$group, mean)

mean_sleep
Output:
1 2

0.75 2.33
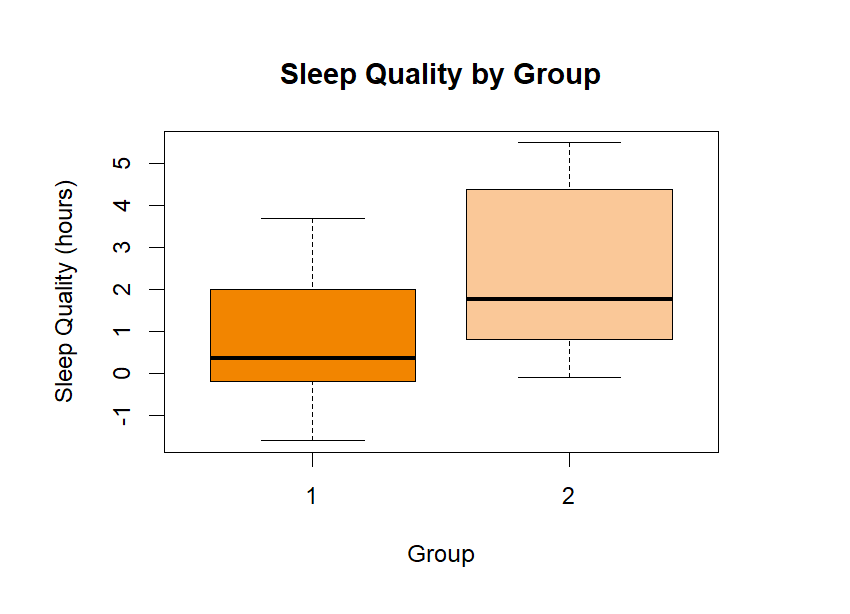
Let’s visualize this using a boxplot.
# Boxplot comparing the before and after

boxplot(extra ~ group, data = sleep,

main = "Sleep Quality by Group",
xlab = "Group", ylab = "Sleep Quality (hours)",
names = c("1", "2"),
col = c("#f28500", "#FAC898"))
Output:
# Paired Sample t-test to check if there's a difference in sleep quality before and after the intervention

paired_t_test <- t.test(
sleep$extra[sleep$group == 1], sleep$extra[sleep$group == 2],
paired = TRUE)

print(paired_t_test)
Output:
Paired t-test

data: sleep$extra[sleep$group == 1] and sleep$extra[sleep$group == 2]

t = -4.0621, df = 9, p-value = 0.002833

alternative hypothesis: true mean difference is not equal to 0

95 percent confidence interval:

-2.4598858 -0.7001142

sample estimates:

mean difference

-1.58
From this output, we can understand that there is a significant difference in sleep quality between the two groups. The mean difference of -1.58 hours. This can be confusing because we saw that group 2 had a higher mean before.
But unlike regular t-tests, the paired sample t-test compares the difference in sleep quality within subjects, not between groups. -1.58 indicates that individuals in Group 1 experienced a decrease in sleep quality after using the drug in Group 2.
The p-value is 0.002833, which is less than 0.05. Hence, we reject the null hypothesis. There is a significant difference in sleep quality between the two groups.
At a 95% confidence interval, the true mean difference in sleep quality lies between -2.4599 and -0.7001 hours.
What situations call for the use of a paired sample t-test? Use this when you need to assess the averages of two connected groups or circumstances, such as pre and post-assessment, paired samples, or repeated observations on the same subjects.
Is it possible to apply a paired sample t-test to multiple related groups beyond two? No. If you have multiple groups, use techniques such as ANOVA or mixed-effects models.
Conclusion
To sum it up, the paired sample t-test is used to compare different situations in the same group. It ensures that no unforeseen differences in the test subjects affect our test. In this article, we discussed the basics of the paired sample t-test and how to perform it in R. Also, learn how to perform the Chi-Square Test in R.