MANOVA is a statistical technique used to analyze the effect that an independent variable has on a set of dependent variables as a whole. In this article, we take a deeper look at what MANOVA is and how to perform it in R.
What is MANOVA?
Usually, when studying the effects of independent variables on dependent variables, we consider each variable separately.
However, this is not always accurate as we sometimes miss interrelationships between dependent variables. MANOVA is a better method that considers the effect of an independent variable on all dependent variables together. This helps uncover deeper insights, patterns, and dependencies.
Multivariate Analysis of Variance (MANOVA) is a statistical testing technique used to compare the means of multiple dependent variables (outcomes) across different groups defined by independent variables (predictors). It's an extension of the well-known one-way ANOVA (Analysis of Variance).
But it is different than ANOVA! ANOVA and MANOVA are both statistical techniques used to compare groups.
ANOVA analyzes the mean difference of a single dependent variable across groups defined by an independent variable. MANOVA on the other hand analyzes the combined effect of an independent variable on multiple dependent variables simultaneously. It considers potential interrelationships between these variables.
Here are some advantages of MANOVA over ANOVA:
- It provides a more comprehensive view by considering the combined effect on multiple variables, providing a more complete picture than analyzing each variable separately.
- It gives a reduced risk of Type I error by controlling for multiple comparisons, reducing the chances of finding false positive results when using multiple ANOVAs.
- It identifies hidden relationships in the data that might be missed by analyzing individual variables.
Choosing the right approach depends on your data. ANOVA is used when you have one dependent variable and one or more categorical independent variables. MANOVA extends ANOVA to situations where there are multiple dependent variables.
The assumptions made by MANOVA are:
- Each data point should be independent of others, meaning they haven't influenced each other and don't share any patterns based on their order or collection process.
- The data should be randomly selected from the population of interest. This ensures your results are representative of the larger population.
- The dependent variables should be normally distributed within each group defined by the independent variable. This means the data points for each dependent variable within each group should follow a bell-shaped curve.
- The covariance matrices representing how the dependent variables vary together should be similar across all groups defined by the independent variable. This means the way the dependent variables relate to each other should be consistent across all groups.
Implementation of MANOVA in R
The manova() function from the base R package is used to perform this technique in R. It has a very simple syntax:
manova(dependent_variables ~ independent_variable)
These are the parameters: dependent_variable is a new composite variable that is a linear combination of all the response variables and Independent_variable is a factor that you're manipulating to see its effects on multiple dependent variables.
Now, let’s take the example of the mtcars dataset. We are analyzing whether the ‘cyl’ (number of cylinders) affects a set of dependent variables, namely, fuel efficiency (mpg), vehicle weight (wt), and engine power (hp):
# Load the mtcars dataset
data(mtcars)

# Define dependent variables
dependent_vars <- cbind(mtcars$mpg, mtcars$wt, mtcars$hp)

# Define independent variable
independent_var <- mtcars$cyl

# Perform MANOVA
manova_results <- manova(dependent_vars ~ independent_var)

# Print the MANOVA results
summary(manova_results)
Output:
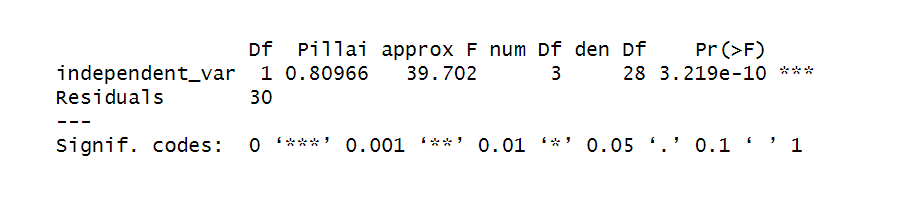
Let’s understand each term in the output:
- Df: Degrees of freedom for each term.
- Pillai: Test statistic measuring the effect of the independent variable. A higher value indicates a stronger effect.
- approx F: Approximation of the F-statistic, another test statistic used for significance testing.
- num Df: Degrees of freedom for the numerator (independent variable).
- den Df: Degrees of freedom for the denominator (error term).
- Pr(>F): P-value, representing the probability of observing such a strong effect by chance. Smaller values indicate stronger evidence against the null hypothesis (no effect).
- Signif. codes: This is to explain the meaning of the symbols you see in the output. These symbols represent the level of significance of the results.
- "*" means the result is extremely unlikely to be just a coincidence.
- "**" means the result is pretty unlikely to be a random chance.
- "." means the result could be due to chance, but it's worth paying attention to.
- " " means the result is probably just due to chance.
The Pillai value (0.80966) is high, suggesting a strong effect of the number of cylinders on the combined measures of mpg, wt, and hp.
The approx F-value (39.702) and p-value (3.219e-10) are very small, indicating strong evidence against the null hypothesis. This means it's highly unlikely that we observed such a strong effect by chance, suggesting a statistically significant relationship.
The '***' means that the result is significant at the 0.001 level (highly significant).
Based on these results, we can see that the number of cylinders significantly impacts the combined characteristics of mpg, wt, and engine hp in the mtcars dataset when considered simultaneously.
How do I interpret MANOVA results? Look at the p-values associated with the test statistics. If the p-value is below a chosen significance level (e.g., 0.05), it indicates significant differences between groups in the combination of dependent variables.
Can I use MANOVA for categorical independent variables? No, MANOVA is used for continuous dependent variables and categorical independent variables. For categorical dependent variables, you might consider MANCOVA or other appropriate techniques.
Conclusion
To sum it up, this helps to find out interrelations among the dependent variables or to gain better insights from the data. In this article, we have seen how to perform the MANOVA test in R.