Suppose your friend asks you if you want to go out tonight. First, you check if you have previously made any plans. Then, you ask about who is coming. Then, you check the weather. You decide to go out only when everything's in your favor. This is basically what decision trees help you do. In this article, we will look at decision trees in R in detail.
What are Decision Trees?
A decision tree is a flowchart of yes/no questions that helps the algorithm make decisions based on the available circumstances. They make decisions by splitting data based on certain criteria. It simplifies decision-making by breaking it down into smaller and easier questions.
It is a supervised machine-learning algorithm that can be used for both classification and regression.
The best part about decision trees is they are extremely easy to follow because they mimic human thinking. They also provide a good visual representation for the user of how the decision is being made.
Apart from this, decision trees work with any kind of data, whether it is numerical, categorical, or mixed. They also work with messy data and outliers. They are particularly useful for data mining and knowledge discovery tasks.
However, they sometimes cause overfitting, i.e., they become too specific to the data used to build them, and they might not work as well with new data. It is also not very good with extremely complex relationships. It is generally better to not use decision trees when your dataset is small, or it has a bunch of random noise.
How do Decision Trees Work?
Here are some of the basic concepts of decision trees:
- Nodes: The points where decisions are made or questions are asked.
- Branches: The connections between nodes, showing the path to take.
- Leaves: The final answers or decisions at the tip of the branches.
- Decision Criteria: The rules that guide how the tree decides which way to go at each node.
- Pruning: Removing unnecessary branches to make the tree less complicated.
As discussed before, decision trees work by recursively partitioning a dataset into subsets based on specific criteria, creating a tree-like structure. Here are the key steps in the decision tree algorithm:
- Starting Point (Root Node): The algorithm begins with a root node that represents the entire dataset.
- Attribute Selection: The algorithm selects the best attribute in the dataset using a measure called Attribute Selection Measure (ASM). Common ASMs include Entropy, Information Gain, and Gini Index.
- Data Partitioning: The dataset is divided into subsets based on the possible values of the chosen attribute.
- Node Creation: A decision tree node is generated, representing the chosen attribute. This node becomes a branch in the tree.
- Recursive Tree Building: This entire process continues until a stage is reached where further classification is not possible, and a leaf node is created.
- Final Decision: The terminal nodes, known as leaf nodes, provide the final decision or prediction. Each leaf node corresponds to a specific outcome based on the attributes' values.
Building a Decision Tree in R
The R function used to create decision trees is rpart(). It uses Information Gain as its Attribute Selection Method (ASM).
The syntax is as follows:
rpart(formula, data, method, control)
Here are the Parameters:
- formula: Tells which variable you want to predict and which variables to use for predictions.
- data: Specifies the dataset where those variables are stored.
- method: Specify the type of model you want, like "anova" for regression or "class" for classification.
- control: Allows you to set various options that control how the decision tree is built, like the depth of the tree.
Decision trees can be used for both classification and regression, so let's look at an example for each.
1) Classification Tree
Let’s look at the popular iris dataset. We need to build a decision tree to classify flowers into 3 species (setosa, versicolor, virginica) based on their sepal and petal dimensions. Here is the example:
# Load required packages
library(rpart)
library(rpart.plot)

# Load Iris dataset
data(iris)

# Set a seed for reproducibility
set.seed(123)

# Create a random index to split the data into train and test sets
index <- sample(1:nrow(iris), 0.8 * nrow(iris))

# Create the training set
train_data <- iris[index, ]
# Create the test set
test_data <- iris[-index, ]

# Create a decision tree model using the training set
model_classification <- rpart(Species ~ Sepal.Length + Sepal.Width + Petal.Length + Petal.Width, data = train_data, method = "class")

# Make predictions on the test set
new_data <- data.frame(Sepal.Length = 5.0, Sepal.Width = 3.0, Petal.Length = 1.5, Petal.Width = 0.2)
prediction <- predict(model_classification, newdata = new_data, type = "class")

# Print the predicted class
print("Predicted Class:")
print(prediction)
Output:
Predicted Class:
1

setosa
Levels: setosa versicolor virginica
Visualizing the Decision Tree
rpart.plot(tree_model, box.palette = "auto")
Output:
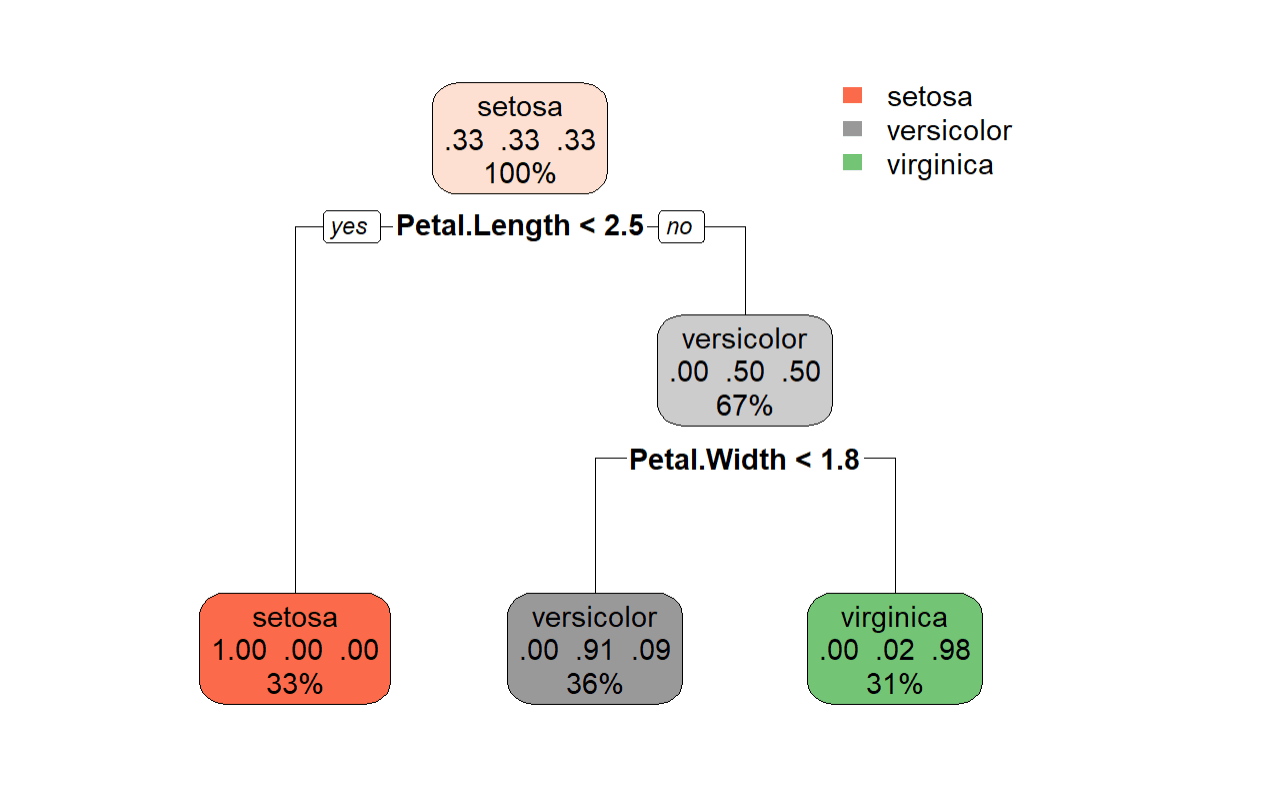
From this visualization of the decision tree, we can clearly understand how the classification is being made.
Calculating the Performance
# Make predictions on the test set
predictions_test_class <- predict(model_classification, newdata = test_data, type = "class")
# Extract actual values for the test set
actual_values_test_class <- test_data$Species

# Calculate Accuracy for the test set
accuracy_test <- sum(predictions_test_class == actual_values_test_class) / length(actual_values_test_class)
cat("Accuracy on Test Set:", accuracy_test, "\n")
Output:
Accuracy: 0.9333333
The decision tree predicts the correct class 93 out of 100 times. This indicates that the performance of our model is pretty good!
2) Regression Tree
Let’s look at the mtcars dataset. This is another popular dataset in R that contains information about cars, and is commonly used for regression tasks in predicting the car performance. We need to build a decision tree to predict the miles per gallon (mpg) of a car based on its weight, horsepower, and quarter-mile time.
Here is the Example:
# Load required packages
library(rpart)
library(rpart.plot)

# Load the mtcars dataset
data(mtcars)

# Set a seed for reproducibility
set.seed(123)

# Create a random index to split the data into train and test sets
index <- sample(1:nrow(mtcars), 0.8 * nrow(mtcars))

# Create the training set
train_data <- mtcars[index, ]
# Create the test set
test_data <- mtcars[-index, ]

# Build the decision tree for regression using the training set
control_params <- rpart.control(minsplit = 2, minbucket = 5)  # Adjust these values as needed
model_regression <- rpart(mpg ~ wt + hp + qsec, data = train_data, method = "anova", control = control_params)

# Make predictions on new data (example)
new_data_reg <- data.frame(wt = 2.5, hp = 150, qsec = 17)
prediction_reg <- predict(model_regression, new_data_reg)
print(prediction_reg)
Output:
17.73333
Visualizing the Decision Tree
rpart.plot(model_regression, box.palette = "auto")
Output:
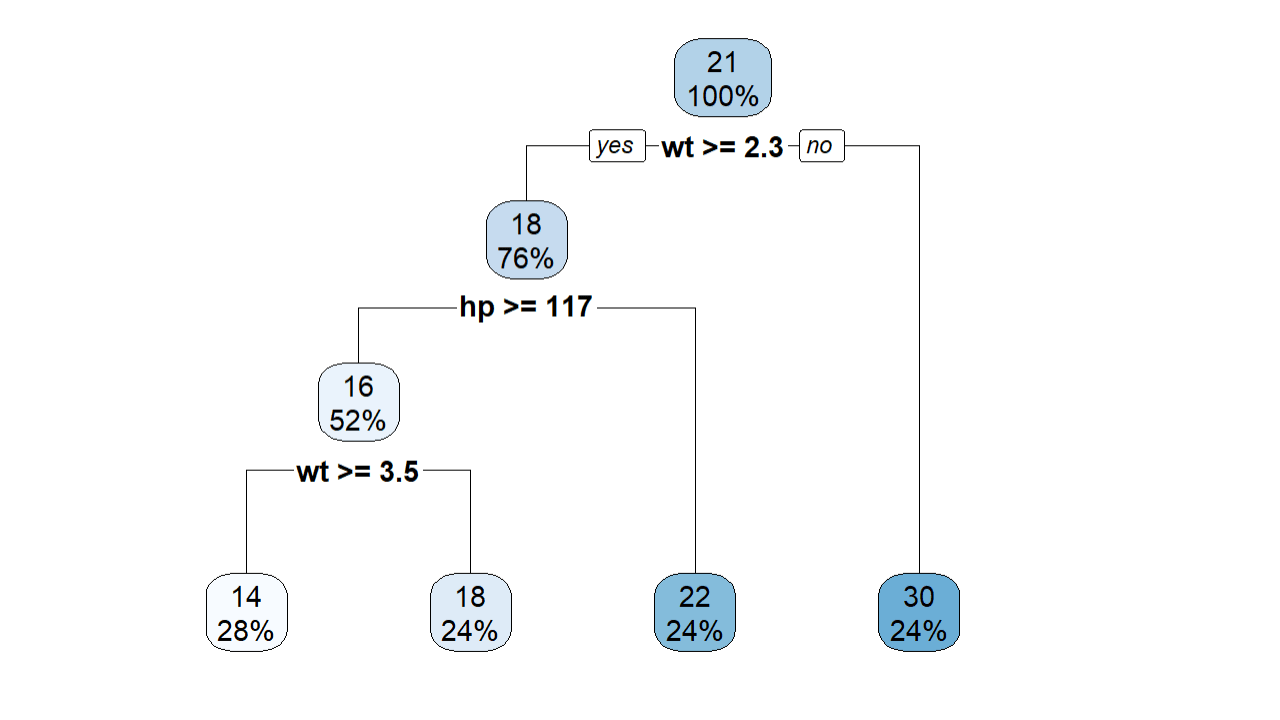
This tree isn’t as easy to understand as the classification tree. In this regression tree, the predicted value of 17.73 is an estimate that is not directly associated with a specific endpoint of the tree. It is derived from the collective characteristics of cars in a similar region of the tree.
In simpler terms, the decision tree is making an educated guess for the average mpg for a car with the specified features, using patterns it learned from the training data. This approach allows the model to offer predictions for a wide range of scenarios, not just those explicitly present in the training set's terminal nodes.
Calculating the Performance
# Make predictions on the test set
predictions_test <- predict(model_regression, test_data)
# Extract actual values for the test set
actual_values_test <- test_data$mpg

# Calculate Mean Absolute Error (MAE) for the test set
mae_test <- mean(abs(predictions_test - actual_values_test))
cat("Mean Absolute Error (MAE) on Test Set:", mae_test, "\n")

# Calculate Mean Squared Error (MSE) for the test set
mse_test <- mean((predictions_test - actual_values_test)^2)
cat("Mean Squared Error (MSE) on Test Set:", mse_test, "\n")

# R-squared for the test set
rsquared_test <- 1 - sum((predictions_test - actual_values_test)^2) / sum((actual_values_test - mean(actual_values_test))^2)
cat("R-squared on Test Set:", rsquared_test, "\n")
Output:
Mean Absolute Error (MAE): 2.955102
Mean Squared Error (MSE): 10.8284
R-squared: 0.08543948
The MAE suggests that our predictions are off by approximately 2.17 mpg. R-squared gives you an idea of how much of the variation in your target variable can be accounted for by the features in your model. Its value lies between 0 and 1, and the closer it is to one, the better.
Overall, we can say that the performance of our regression tree is not too good, Of course, you can improve it further by tweaking the hyperparameters a little, using ensemble methods like random forest, and handling outliers and other messy parts of the data to get a better performance.
Conclusion
In a nutshell, decision trees guide you through a series of yes/no questions to simplify decision-making. They are versatile tools, capable of handling various data types and scenarios, making them suitable for both classification and regression tasks. Now you know how to build decision trees in R with examples. You can also use it to build your R programming project as a beginner to practice.