Many companies and organizations function on user data. Data is a crucial part of any business, but the data that any organization possesses is generally raw, one cannot utilize such data to its full potential, here is where Data wrangling comes into the picture. Data wrangling helps companies to convert raw non-resourceful data into useful data. This data is then used for data analysis and creating predictive analysis for the business. In this article, I will walk you through what is data wrangling, the data wrangling tools, why we need it, the 6 steps involved, and its relation with machine learning. So let’s begin!
What is Data Wrangling?
Data wrangling is the method of restructuring, cleaning, and enriching the raw data available into a more processed format. It is also known as data munging. This helps the data scientists to fasten the decision-making process, and thus benefit the company. This method is adopted by a huge number of high-end firms, partly owing to the perks it has and partly because of the huge amounts of data which the firm analyzes and processes. Feature engineering the data before analysis has proven to be extremely useful and helps the firms quickly analyze huge amounts of data.
Now that we know what exactly is data wrangling let us discuss various tools used for data wrangling.
Basic Data wrangling Tools
- Excel Power Query / Spreadsheets: it is the basic manual structure wrangling tool.
- OpenRefine: more sophisticated solutions, requires programming.
- Google DataPrep: for data exploration, cleaning, and feature engineering.
- Tabula: it's suitable for all kinds of data.
- DataWrangler: used for data cleaning and transformation.
- CSVKit: used for converting data.
Need of Wrangling
In layman's terms, data wrangling is very important because it’s the sole way to make use of raw data. In practical business settings, the user information comes in different pieces from different backgrounds at times. Sometimes, we store this information across various computers across different spreadsheets, e.g. CRM, and on different systems which can sometimes lead to data redundancy, incorrect data, or missing data. To create a transparent and efficient system for data management, the best solution is to have all data in a centralized location so it can be used. This is another data automation tool to help the data wrangling process.
The best data munging method involves bringing together raw data and also understanding the trends of the data. In this way, good data wrangler should be able to interpret, clean, and transform data into valuable insights to create predictions and analysis for business purposes.
6 Steps in Data Wrangling
Similar to most data analytics processes, data wrangling is an iterative one – the data engineer iterates through these steps repeatedly to create the desired predictions. There are 6 broad steps in data wrangling, which are:
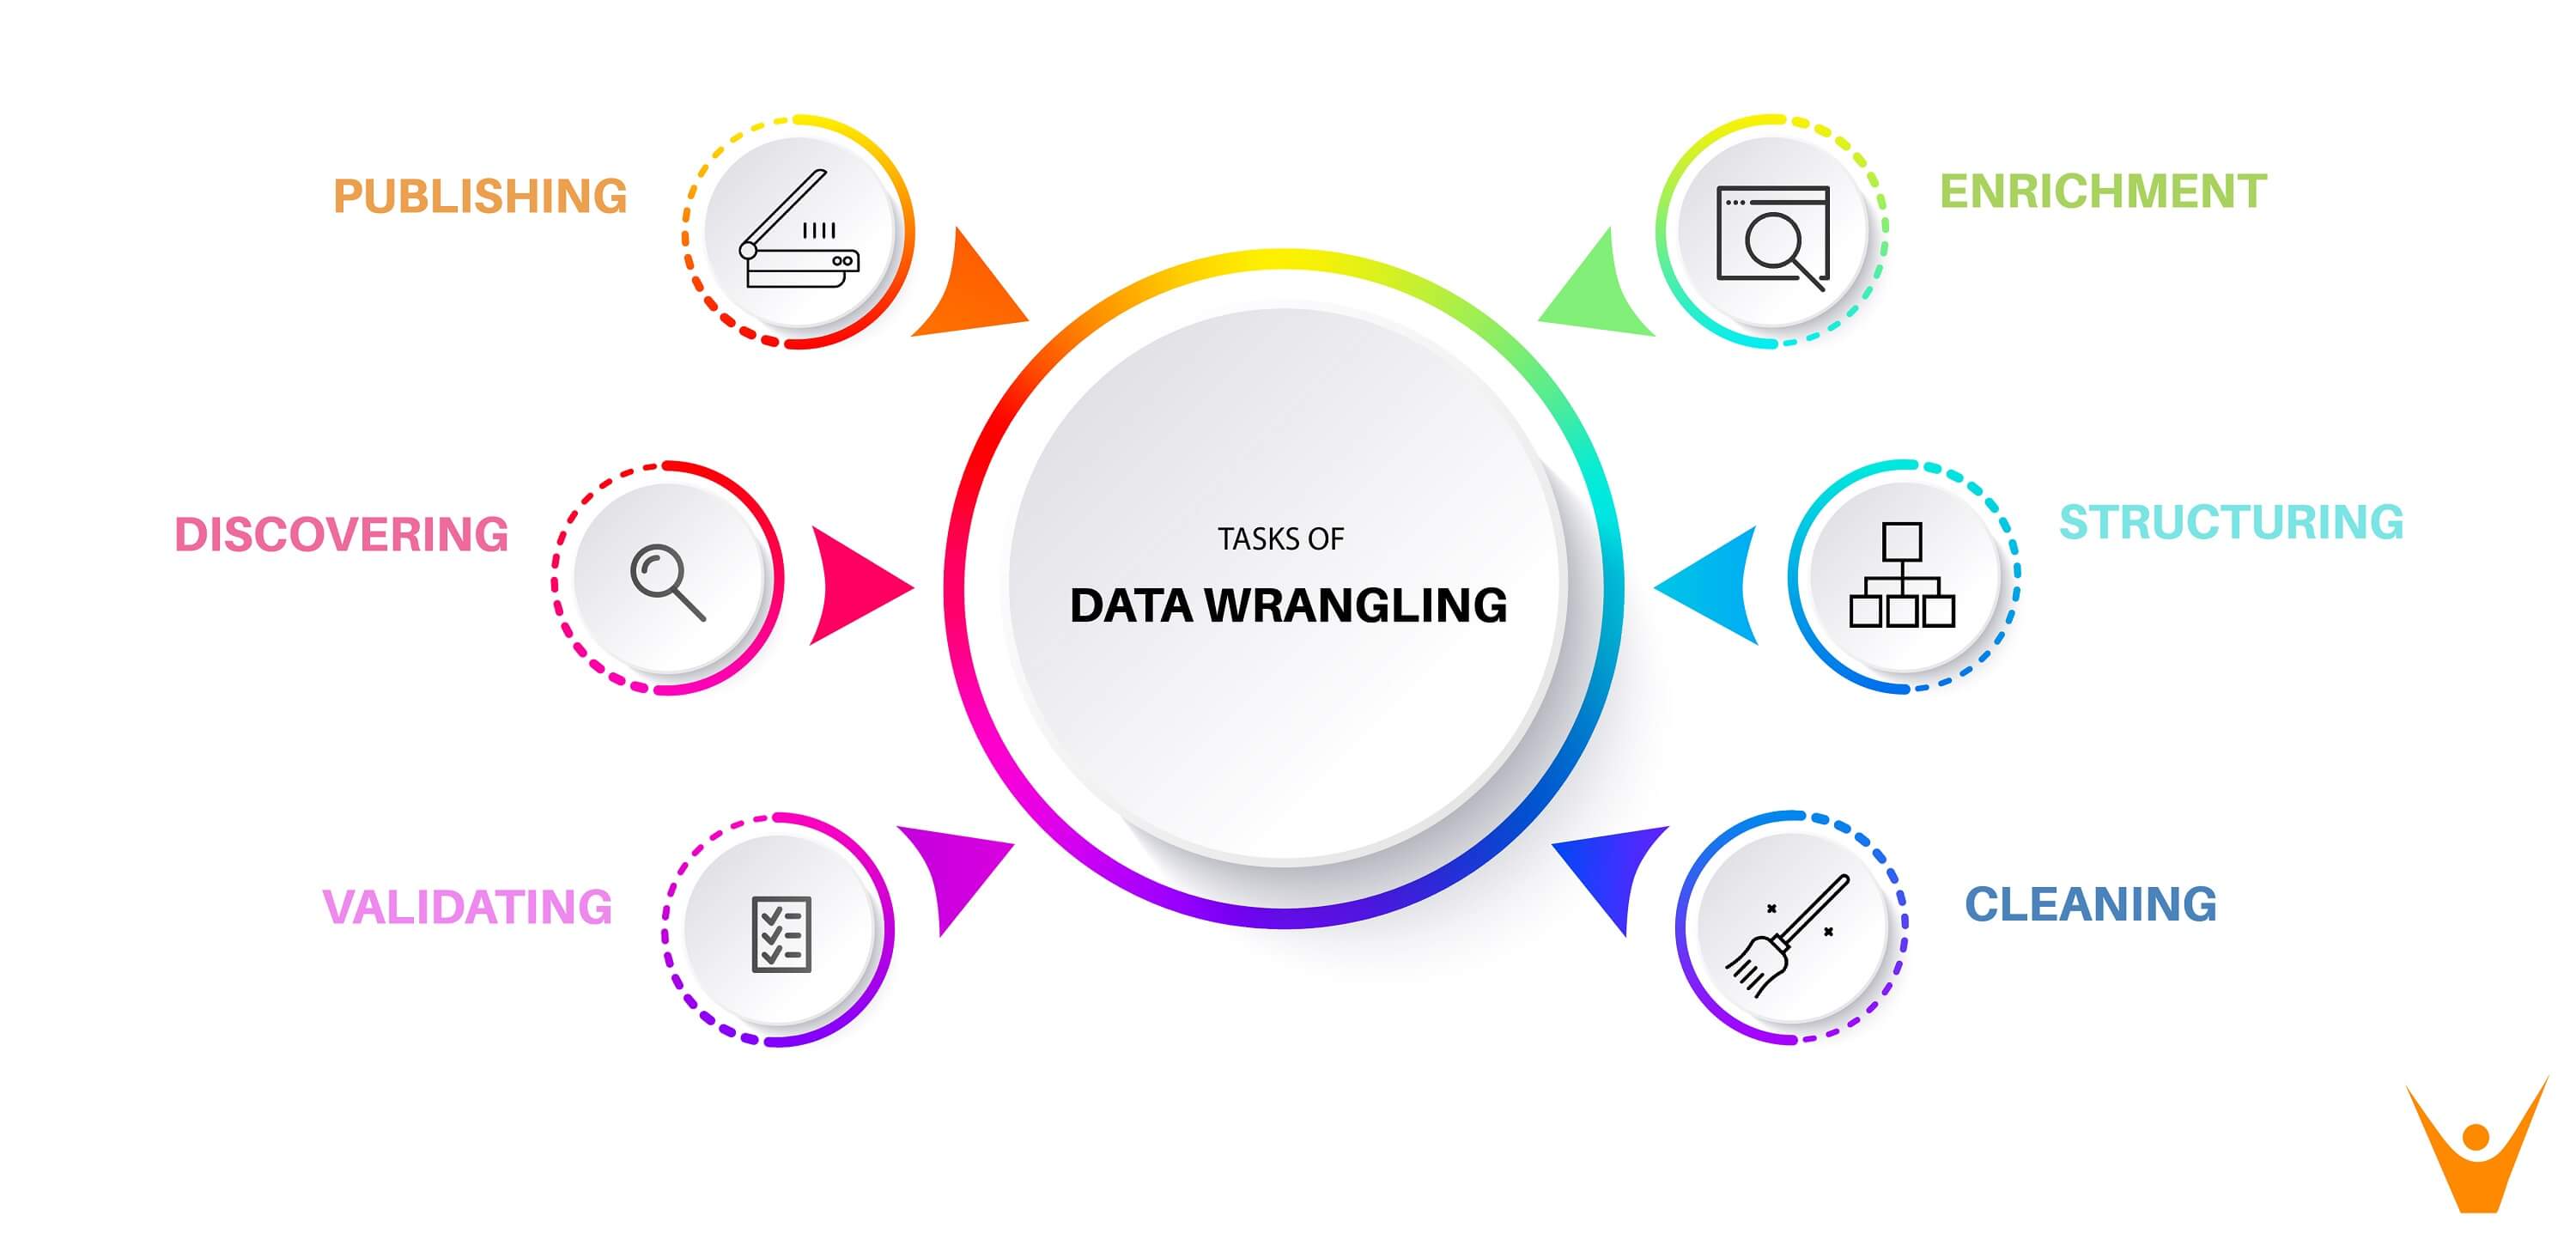
- Discovering: The first step in data wrangling is analyzing the data before imputing the data. Wrangling needs to be done in a systematic fashion, based on some criteria which could demarcate and divide the data accordingly – these are identified in this step.
- Structuring: In most cases, the raw data extracted as user information generally doesn’t have structured data. The data should be restructured in a fashion that better suits the analytical method used. Based on the category identified in the first step, the data should be segregated to make use easier. For better analysis we have to select one column that may become two or rows may be split, this is also called feature engineering.
- Cleaning: Processed datasets definitely have some outliers, which can skew the results of the analysis. The dataset should be cleaned for optimum results. In this step, the data is cleaned thoroughly for high-quality data analysis. Null values should be imputed, and the formatting will be standardized to create higher quality processed data.
- Enriching: After processing the data, it will have to be enriched – this is performed in the fourth step. This implies that you one has to take stock of what is in the data and strategize whether you have upscale, downsample, or perform data augmentation. There are different methods to resample the data, one downsampling the data, and the other creating synthetic data using upsampling.
- Validating: Validation refers to iterative programming steps that are used to verify the consistency and the quality of data after processing. For example, you will have to ascertain whether the fields in the data set are accurate via validating data, or checking whether the attributes are normally distributed.
- Publishing: The processed and wrangled data is published so that it can be used further – which is the sole purpose of data wrangling. If needed, the complete data wrangling process should be documented efficiently for the users and clients for easy usage.
Data Wrangling in Machine Learning
Machine learning and data science is all about processing and data wrangling. There are many different types of machine learning algorithms according to the type of data, but the crucial part of the analysis process is Data wrangling which makes the raw data simpler for analysis and machine learning operations.
Machine learning has definitely become a buzzword! But it’s not actually a recent concept; in fact, it’s been around for decades. When you break it down into different phases, machine learning is basically a set of techniques that enables computers to “learn” patterns from a set of data. If you think of a computer as the student, and a data scientist as the professor, then machine learning algorithms are teaching methods and historical data are homework. Once computers have learned from their “homework” and developed models, they can make automated decisions on new data. Ultimately, this is what makes it possible for artificial intelligence to scale, without machine learning, having to manually program all of the possible scenarios for each user interaction would be near impossible.
In recent times, with the increase in the amount of data and growing computing power available, more and more companies are adopting machine learning to optimize all parts of their business and use the data in the most productive way. In practice, one can analyze the importance of the machine learning systems which is the best way to handle user data and create optimum services using the concepts of data wrangling; it's now easier to implement machine learning algorithms.
Data Wrangling in Python
- Numpy (aka Numerical Python): It’s the most basic python package for data science. One can perform operations on n-arrays and matrices in Python using Numpy. It provides vectorization of mathematical operations on the NumPy array type, which helps improve performance and accordingly speeds up the execution of the python code.
- Pandas: It makes data analysis operations faster and easier. Useful for data structures with labeled axes. Some data alignment prevents common errors that can be extracted from misaligned data during data scraping.
- Matplotlib: It’s the most common python visualization module. One can create line graphs, pie charts, histograms, and other professional-grade figures.
- Plotly: for interactive, publication-quality graphs. Great for creating line plots, scatter plots, area charts, bar charts, error bars, box plots, histograms, heatmaps, subplots, multiple-axis, polar graphs, and bubble charts.
- Theano: A python library for numerical computation similar to Numpy. This library is created to define, optimize, and evaluate mathematical expressions involving multi-dimensional arrays efficiently.
Data Wrangling in R
- Dplyr: It is a necessary data-munging R package and a supreme data framing tool. Especially useful for operating on categorical data.
- Purrr: It’s apt for creating list function operations and error-checking.
- Splitstackshape: Great for restructuring complex datasets and simplifying the visualization.
- JSOnline: It's a great and easy parsing tool.
- Magrittr: good for wrangling scattered datasets and putting them into a more coherent form.
Conclusion
Data wrangling in machine learning is a huge necessity in recent times because of the huge amounts of data that gets processed every day making user services more efficient. Without a strong infrastructure of data storage and investments in data wrangling techniques, the business would suffer and hence data-wrangling proves its importance in the world of data science. Hope this article helped you understand the concept of Data wrangling better, along with a list of best data wrangling tools. Happy Learning!