
Data visualization is an essential practice in the fields of Data Science, Statistics, Data Analysis, and other related fields. R programming, a powerful statistical and mathematical programming language stands at the center of it, offering a wide variety of powerful and user-friendly options to create such visually appealing and informative plots. One of the key elements in crafting effective plots is the ability to control the appearance of data points. This is where the pch parameter in R comes into play. In this blog post, we'll dive into the pch in R, exploring its functionality, various symbols, and how it can be used to enhance the expressiveness of your plots and make them more visually appealing.
Understanding PCH in R
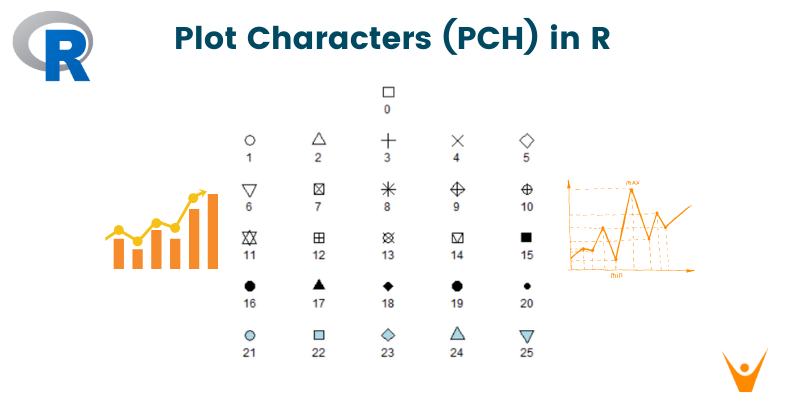
The pch parameter, "plot character," is a crucial aspect of the plot() function in R. It allows you to specify the symbol or character to be used for plotting data points in a scatter plot. By default, R uses circles (pch = 1) for plotting. The importance of pch lies in its wide versalite selection palette for us to choose from. You can choose from a wide range of symbols to represent your data points, each carrying its own meaning or significance.
Common pch Symbols in R
Let's start by exploring some of the commonly used pch symbols in R and understanding how to implement them in your plots.
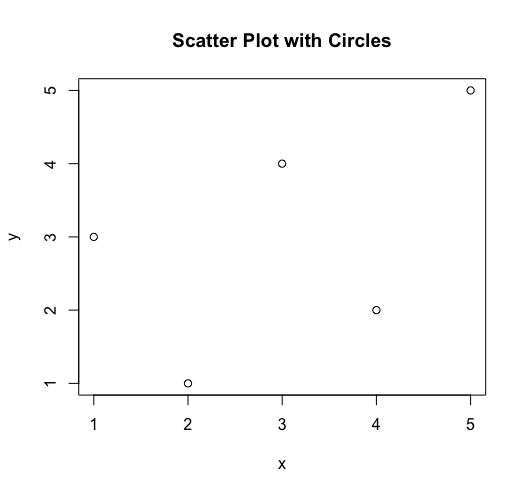
1. Circles (pch = 1):
The default symbol, a simple circle, is suitable for most basic scatter plots. It provides a clean representation of data points.
plot(x, y, pch = 1, main = "Scatter Plot with Circles")
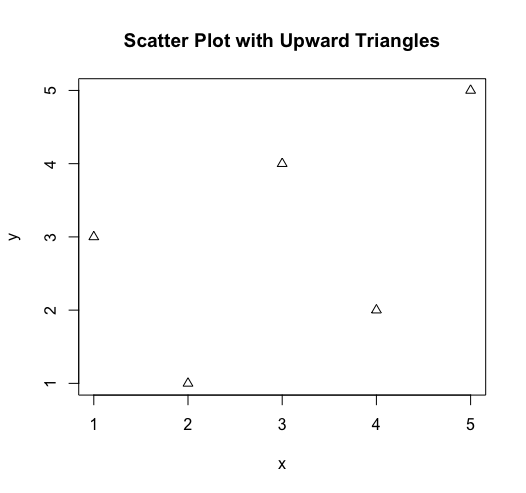
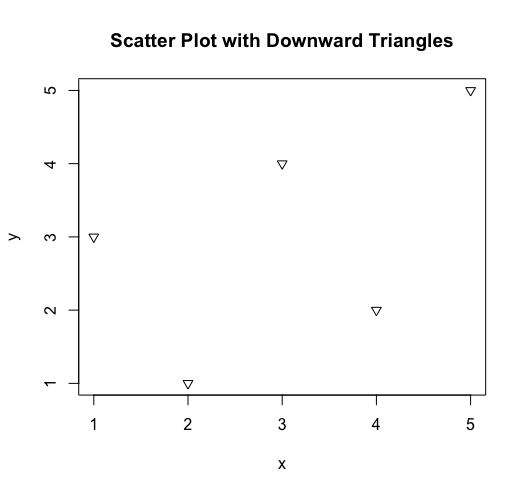
2. Triangles (pch = 2, 3):
Triangles are often used to indicate directionality or significance. The triangle's orientation can be controlled by specifying pch = 2 for upward-pointing triangles and pch = 6 for downward-pointing triangles.
# Upward-pointing triangles
plot(x, y, pch = 2, main = "Scatter Plot with Upward Triangles")

# Downward-pointing triangles
plot(x, y, pch = 6, main = "Scatter Plot with Downward Triangles")
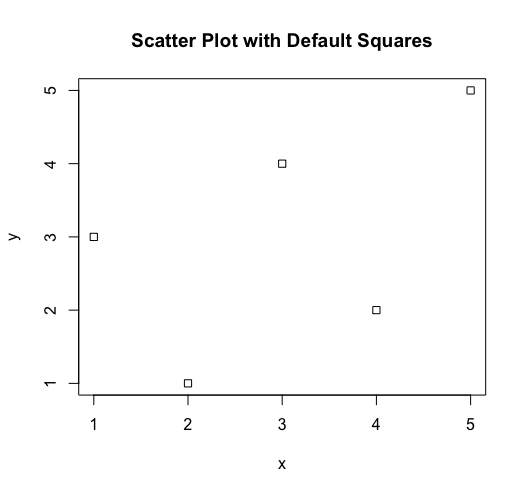
3. Squares (pch = 0, 4):
Squares are a sturdy and straightforward symbol. The default square is obtained with pch = 0, while a rotated square can be achieved with pch = 4.
# Default square
plot(x, y, pch = 0, main = "Scatter Plot with Default Squares")

# Rotated square
plot(x, y, pch = 4, main = "Scatter Plot with Rotated Squares")
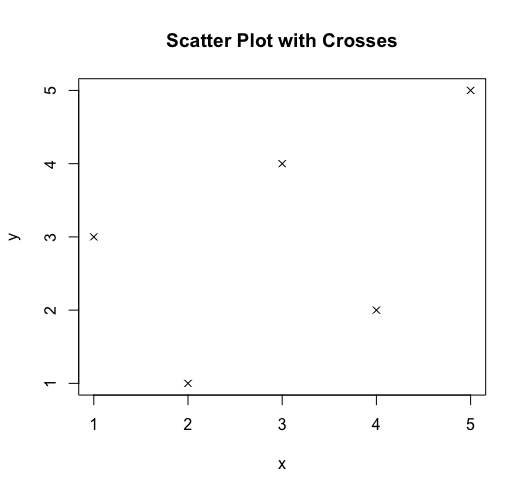
4. Crosses (pch = 7):
Crosses are often used to highlight specific data points or outliers. They provide a clear and easily distinguishable symbol.
plot(x, y, pch = 7, main = "Scatter Plot with Crosses")
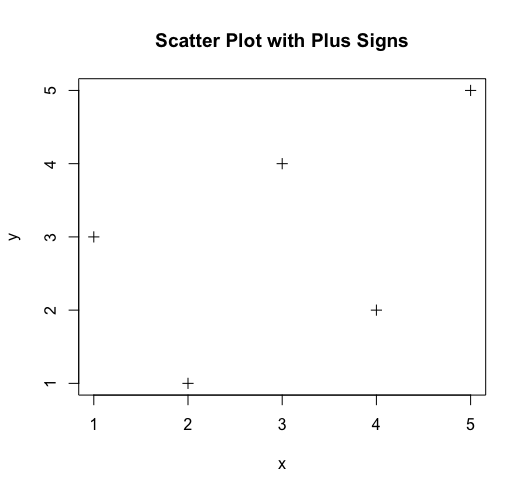
5. Plus Sign (pch = 6):
The plus sign is a simple yet effective symbol for denoting key data points. It is especially useful when you want to draw attention to specific observations.
plot(x, y, pch = 3, main = "Scatter Plot with Plus Signs")
For the increased ease of accessibility to use the pch function, we can directly call the pch attribute from the plot() function, as shown in the code above.
Using PCH in Combination with Other Parameters:
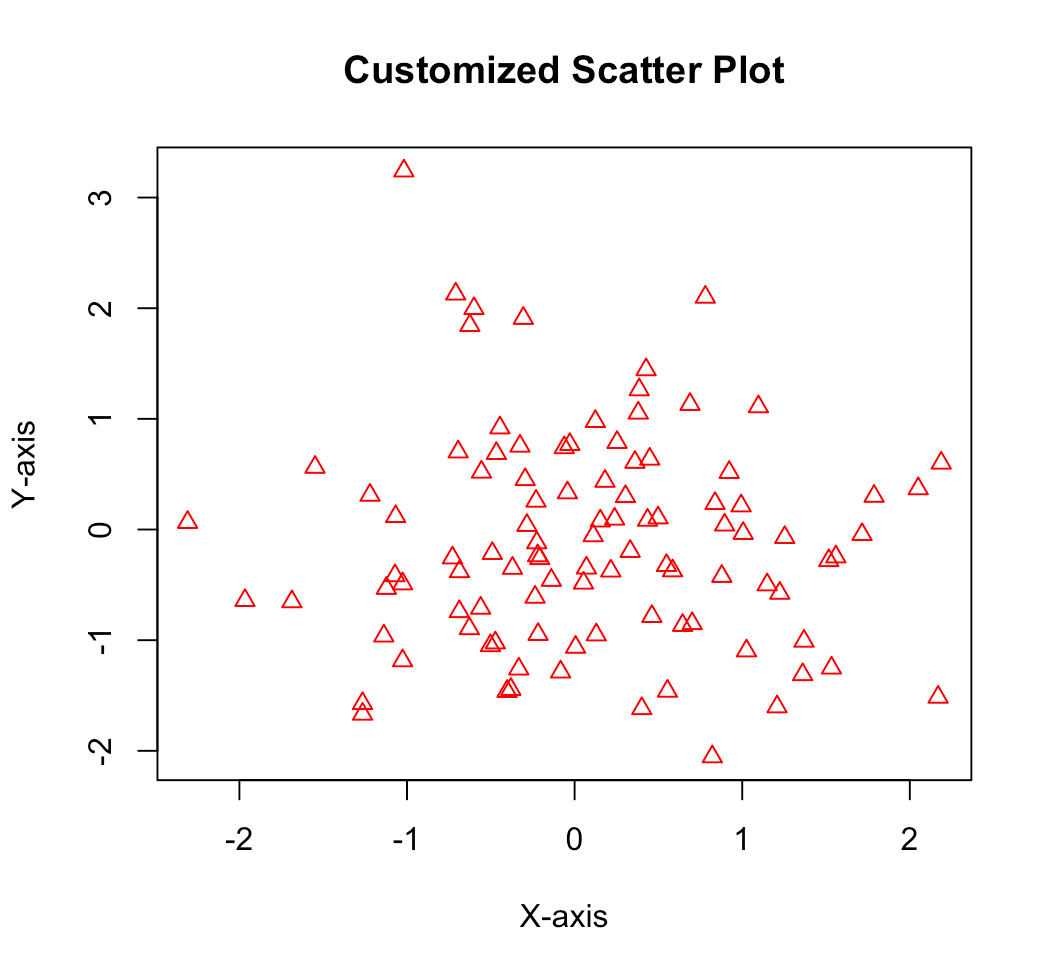
To elevate your scatter plots, you can take it a step further by combining the pch parameter with other graphical features in the plot() function. For example, you have the flexibility to customize the color of the symbols, add labels, and exert control over the axes:
plot(x, y, pch = 2, col = "red", main = "Customized Scatter Plot", xlab = "X-axis", ylab = "Y-axis")
In certain scenarios, you might want to dynamically select the pch symbol based on some conditions in your data. This can be done by using conditional statements within the plot() function, as shown in this example:
if (condition) {
  plot(x, y, pch = 1, main = "Scatter Plot with Circles")
} else {
  plot(x, y, pch = 2, main = "Scatter Plot with Triangles")
}
In this example, the plot character is dynamically selected based on a condition. This approach can be tailored to meet the specific needs of your data analysis.
Creating Symbolic Expressions with PCH
R allows you to create complex symbolic expressions by combining multiple pch values in a single plot. This can be particularly useful when you want to convey multiple dimensions of information within a single scatter plot.
plot(x, y, pch = c(0, 1, 2, 3, 4), col = c("red", "blue", "green", "orange", "purple"), main = "Combined Scatter Plot")
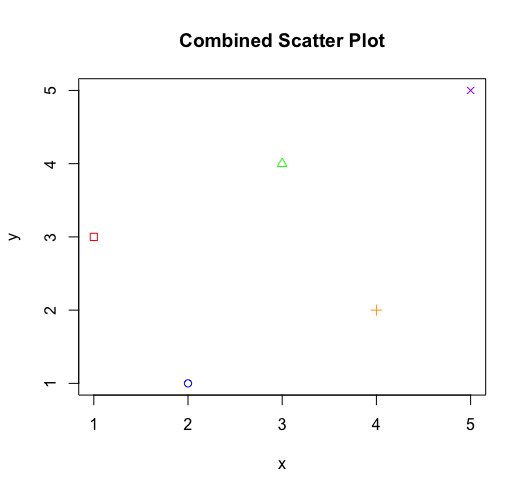
In this example, the plot includes squares, circles, upward triangles, downward triangles, and rotated squares, each represented by a different color.
Advanced Symbolic Expressions
To create even more expressive scatter plots, you can leverage the pch parameter along with other graphical parameters and functions. For example, you can adjust the size of symbols based on a numeric variable:
plot(x, y, pch = 16, cex = variable, col = "blue", main = "Scatter Plot with Varying Symbol Size")
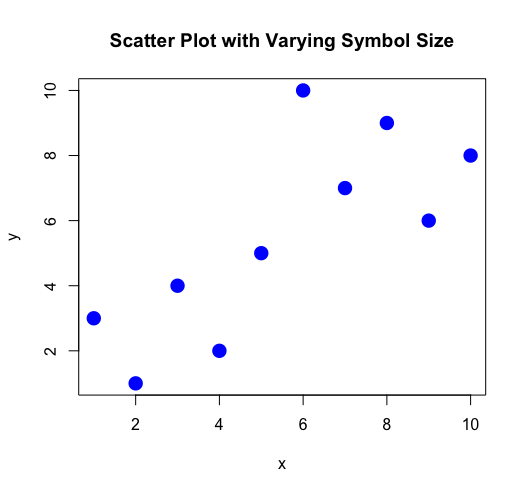
Here, the cex parameter controls the size of the plot symbols based on the values in the "variable" variable. For our demonstration, we set the variable to 2.
Conclusion
The PCH parameter in R is a powerful tool for customizing the appearance of scatter plots. By choosing from a variety of symbols and combining them with other graphical parameters, you can create visually appealing and informative plots that effectively communicate your data. Experiment with different symbols, colors, and sizes to find the combination that best suits your data and tells the story you want to convey.


