

R stands out as a powerful language for data visualization. The heatmap is one of the best tools for data visualization. They are a type of visual representation of data that makes it easier to spot patterns, trends, and relationships by using color gradients to represent values. In this article, we will deep dive into the world of heatmaps in R and the popular complexheatmap package.
What is Heatmap in R?
A heatmap is a matrix represented graphically, with the values of each corresponding element represented by the color of the cell. When working with large datasets, this visual representation is very helpful because it enables us to spot trends, outliers, and clusters quickly.
Using different packages makes it simple to create a heatmap in R; the standard function heatmap() allows for basic heatmap creation. On the other hand, the complexheatmap package has become a popular option for more sophisticated and customizable heatmaps that can cater to our custom and specific needs.
Here is the code to better understand it:
cor_matrix <- cor(mtcars)

heatmap(cor_matrix,
        col = colorRampPalette(c("blue", "white", "red"))(20),
        main = "Correlation Heatmap")
Plot:
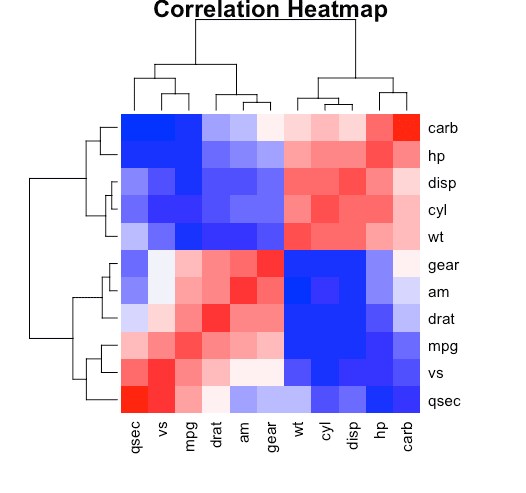
This simple example uses a color gradient that goes from blue (low correlation) to red (high correlation) to create a heatmap.
Advanced Heatmaps - ComplexHeatmap
A wide range of functions are available in the complexheatmap package in R that allows us to make highly customizable and informative heatmaps. Users can adjust the heatmap's colors, annotations, and clustering, among other features. Using some examples, let's examine some of the main functions of the complexheatmap package.
It's necessary to install and load the complexheatmap package before we start looking at its code examples.
install.packages("ComplexHeatmap")
library(ComplexHeatmap)
Let's now use the complexheatmap package to create a basic heatmap with the same correlation matrix we used in the previous example:
Heatmap(cor_matrix, name = "Correlation", col = circlize::colorRamp2(c(-1, 0, 1), c("blue", "white", "red")))
Plot:

This example uses the Heatmap() function from the complexheatmap package to create a simple heatmap with default settings. The heatmap title is set by the name argument, and the color gradient is specified by the col argument.
One of the strengths of the complexheatmap package is its ability to customize the appearance of the heatmap. Let us take a look at some of the customizations available to us:
Heatmap(cor_matrix,
        name = "Correlation",
        col = circlize::colorRamp2(c(-1, 0, 1), c("blue", "white", "red")),
        show_row_names = FALSE,   # Hide row names
        show_column_names = FALSE,  # Hide column names
        cluster_rows = TRUE,   # Cluster rows
        cluster_columns = TRUE,   # Cluster columns
        column_title = "Variables",
        row_title = "Variables",
        row_title_side = "left",
        row_title_gp = gpar(fontsize = 10, fontface = "bold"),
        heatmap_legend_param = list(title_position = "topcenter",
                                     title_gp = gpar(fontsize = 12, fontface = "bold"),
                                     legend_direction = "horizontal"))
Plot:
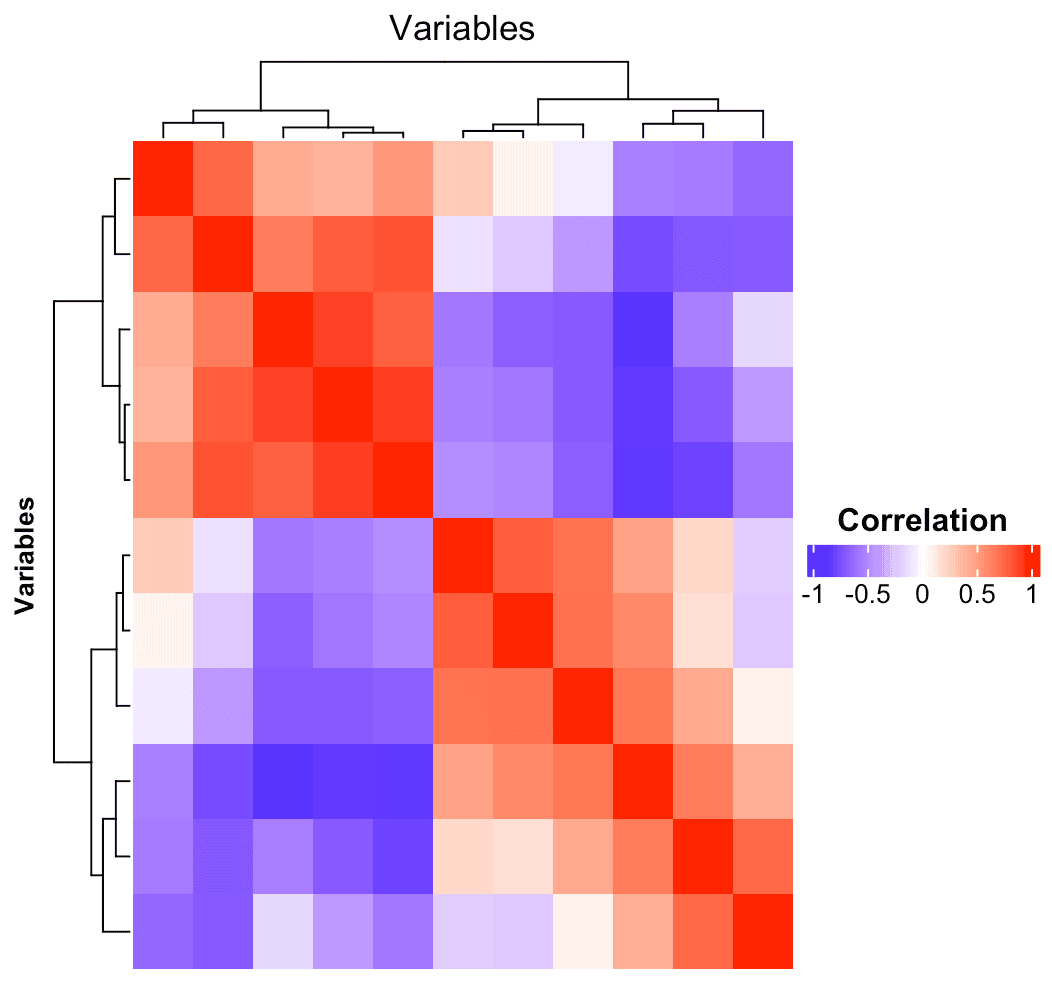
We have customized several aspects of the heatmap in this example. It includes hiding row and column names, clustering rows and columns, adding titles, and adjusting the appearance of the row titles and legend.
What is Pheatmap Function?
The pheatmap function is another popular option for making heatmaps in R. Even though the complexheatmap package offers many customization options. For users who prefer a more direct approach, the pheatmap package is a great choice because of its well-known simplicity and ease of use.
Here is an example:
install.packages("pheatmap")
library(pheatmap)

pheatmap(cor_matrix,
         color = colorRampPalette(c("blue", "white", "red"))(20),
         main = "Correlation Heatmap")
Plot:

In this example, we use the pheatmap function to create a basic heatmap similar to the one created using the base heatmap() function. The heatmap title is set by the main argument, and the color argument defines the color gradient.
Create Circular Heatmap
R circular or "circlized" heatmaps are a unique and visually appealing method of displaying large, complicated datasets. Circluse::circos.heatmap() is the main function in the circle package that creates circular heatmaps.
Similar to rectangular heatmaps, you can create circular heatmaps with this function by providing a matrix of values. The circular arrangement is the main benefit, as it can be especially helpful for showcasing patterns or displaying cyclic data that might not be as clear in a linear layout.
Let's explore the key concepts and benefits of circled heatmaps in R:
install.packages("circlize")
library(circlize)

mat <- matrix(rnorm(100), ncol = 10)
circos.heatmap(mat = cor_matrix, col = circlize::colorRamp2(c(-1, 0, 1), c("blue", "white", "red")))
Plot:
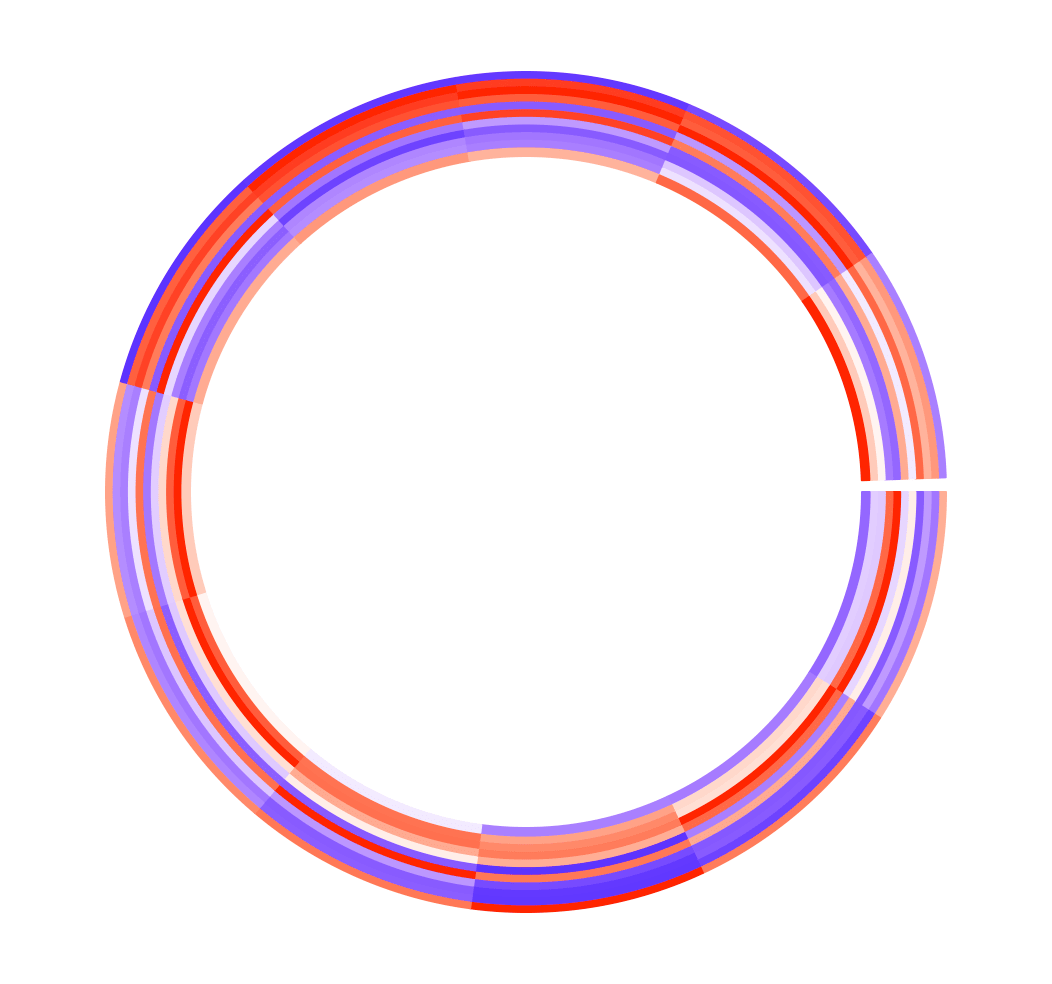
The relationships and patterns found in datasets can be highlighted especially well with circular heatmaps. Clusters, correlations, and cyclic trends are easier to find when data is arranged circularly.
For example, let's say you wish to see the correlation matrix between several variables:
cor_matrix <- cor(mtcars)
circos.heatmap(cor_matrix, col = colorRamp2(c(-1, 0, 1), c("blue", "white", "red")))
Plot:
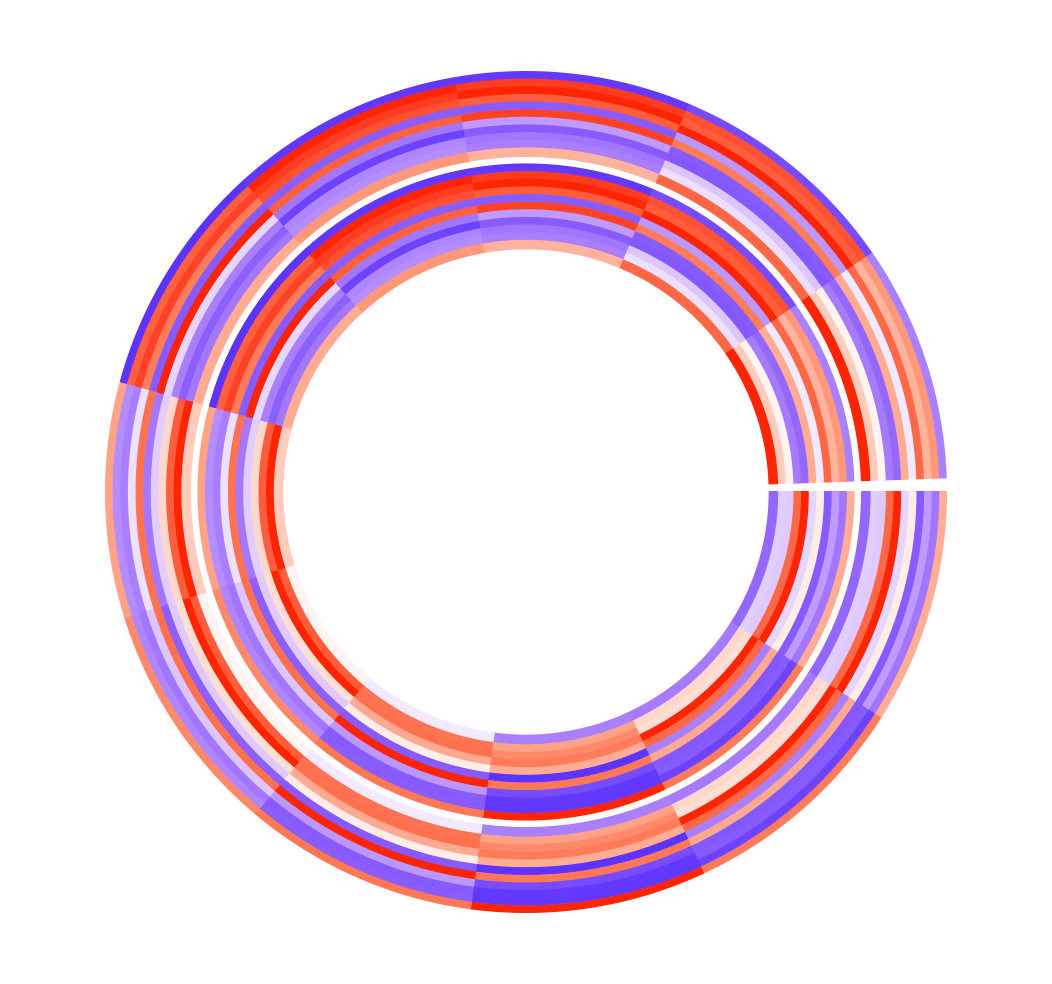
In this example, the circular arrangement can reveal patterns in the correlation structure that may not be as apparent in a traditional rectangular heatmap.
Users can customize heatmaps to meet their unique analytical requirements with the help of R's versatile toolkit, which includes packages like complexheatmap and pheatmap that offer both flexibility and simplicity.
Conclusion
Overall, heatmaps are powerful tools for visualizing complex datasets. The complexheatmap package, with its wide range of customization options, excels at creating intricate and informative heatmaps. On the other hand, individuals looking for a quick fix tend to favor the Pheatmap package due to its simplicity.


