


Pandas is a powerful Python library that is near and dear to data scientists. Specifically, one of the most commonly used techniques in time series analysis is the moving average, which is a favored tool for smoothing out data and identifying trends. In this article, we will explore the various techniques we can use to calculate Moving Averages in Pandas.
But first, let us briefly understand the concept of moving averages and its various types.
What is the Moving Average?
A moving average calculates the average of data points over a specified period. This helps smooth out the price fluctuations or noise and identify underlying trends in the data.
There are three primary types of moving averages:
- Simple Moving Average (SMA): It is the unweighted mean of the previous data points. For instance, if you have a series of 10 numbers and you want to calculate a rolling 3-point moving average, the first moving average value would be the average of the first three numbers, the second would be the average of numbers two through four, and so on.
- Weighted Moving Average (WMA): As the name suggests, it assigns different weights to the data points. The weights depend on the significance of the data point. The most recent data points might be given more weight because they are more relevant.
- Exponential Moving Average (EMA): Exponential Moving Average is a type of weighted moving average where more weight is given to the latest data. EMA is more sensitive to recent price changes than the Simple Moving Average.
Calculating the Moving Average in Pandas
Now that we understand the concept of moving average, let us create a sample dataset and try to calculate the moving average of the data.
Pandas provides a convenient way to calculate moving averages using the rolling() function. This function creates a window of a specified size over the DataFrame and applies a specified function to the values in the window. The size of the window determines the number of data points used to calculate the moving average.
Let us see an example:
import pandas as pd
import numpy as np
import matplotlib.pyplot as plt

# Generate a sample dataset
np.random.seed(42)  # for reproducibility
date_rng = pd.date_range(start='2022-01-01', end='2022-12-31', freq='D')
data = np.random.randint(30, 70, size=(len(date_rng)))
df = pd.DataFrame(data, columns=['Value'], index=date_rng)

# Calculate the moving average
window_size = 7  # You can adjust the window size as needed
df['Moving_Avg'] = df['Value'].rolling(window=window_size).mean()

# Plot the original data and the moving average
plt.figure(figsize=(10, 6))
plt.plot(df['Value'], label='Original Data')
plt.plot(df['Moving_Avg'], label=f'Moving Average ({window_size} days)')
plt.title('Original Data and Moving Average')
plt.xlabel('Date')
plt.ylabel('Value')
plt.legend()
plt.show()
Output:

Now, let us try to find the various types of moving averages and also see an example,
Calculating Simple Moving Average
The simple moving average is the most basic type of moving average. It provides a smoothed representation of the data by calculating the average of a fixed number of previous data points. To calculate the simple moving average using Pandas, we can use the rolling() function with the mean() method.
Here is the code to do it:
import pandas as pd
import numpy as np
import matplotlib.pyplot as plt

# Generate a sample dataset
np.random.seed(42)  # for reproducibility
date_rng = pd.date_range(start='2022-01-01', end='2022-12-31', freq='D')
data = np.random.randint(30, 70, size=(len(date_rng)))
df = pd.DataFrame(data, columns=['Value'], index=date_rng)

# Calculate the simple moving average
window_size = 20  # You can adjust the window size as needed
df['SMA'] = df['Value'].rolling(window=window_size).mean()

# Plot the original data and the moving average
plt.figure(figsize=(10, 6))
plt.plot(df['Value'], label='Original Data')
plt.plot(df['SMA'], label=f'Simple Moving Average ({window_size} days)')
plt.title('Original Data and Simple Moving Average')
plt.xlabel('Date')
plt.ylabel('Value')
plt.legend()
plt.show()Output:

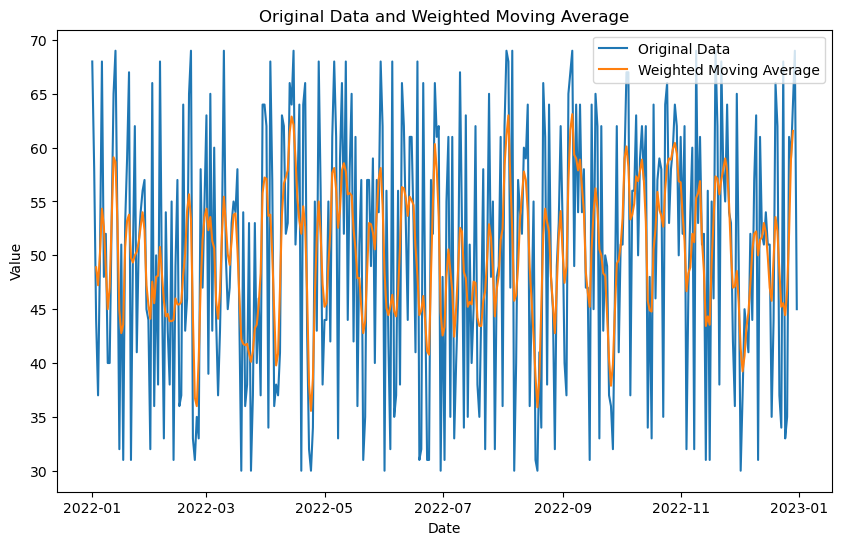
Calculating Weighted Moving Average
The weighted moving average assigns different weights to different data points based on their importance or relevance. This type of moving average gives more significance to recent data points.
To calculate the weighted moving average using Pandas, we can use the rolling() function along with the apply() method and a custom function that applies the weighted calculation. Let us see an example:
import pandas as pd
import numpy as np
import matplotlib.pyplot as plt

# Generate a sample dataset
np.random.seed(42)
date_rng = pd.date_range(start='2022-01-01', end='2022-12-31', freq='D')
data = np.random.randint(30, 70, size=(len(date_rng)))
df = pd.DataFrame(data, columns=['Value'], index=date_rng)

# Define a custom function to calculate weighted moving average
def weighted_average(window):
    # Define weights for the weighted moving average
    weights = np.array([0.1, 0.2, 0.3, 0.2, 0.1])  # Adjust weights as needed
    return np.sum(window * weights) / np.sum(weights)

# Calculate the weighted moving average using apply()
df['Weighted_Moving_Avg'] = df['Value'].rolling(window=len(weights), center=True).apply(weighted_average, raw=True)

# Plot the original data and the weighted moving average
plt.figure(figsize=(10, 6))
plt.plot(df['Value'], label='Original Data')
plt.plot(df['Weighted_Moving_Avg'], label='Weighted Moving Average')
plt.title('Original Data and Weighted Moving Average')
plt.xlabel('Date')
plt.ylabel('Value')
plt.legend()
plt.show()Output:
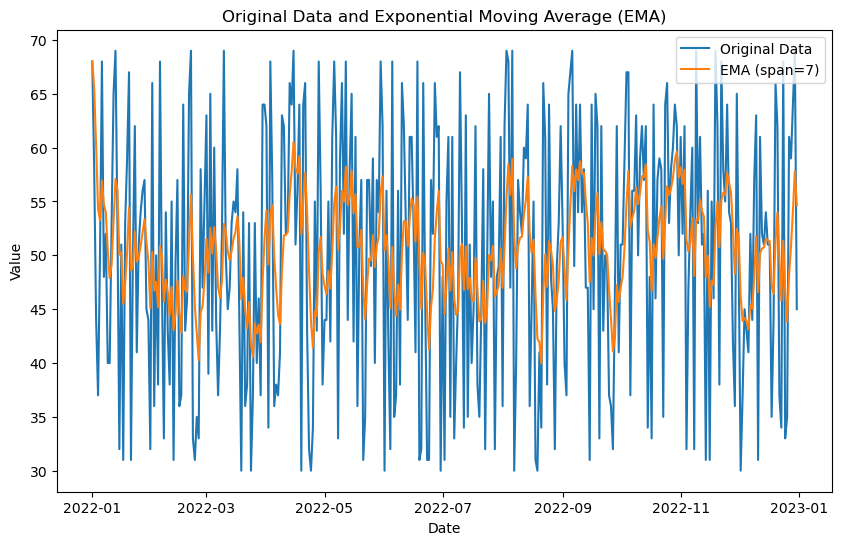
Calculating Exponential Moving Average
The exponential moving average assigns greater weights to more recent data points, making it more responsive to recent changes in the data. To calculate the exponential moving average using Pandas, we can use the ewm() function with the mean() method. Here is the code in Python:
import pandas as pd
import numpy as np
import matplotlib.pyplot as plt

# Generate a sample dataset
np.random.seed(42)
date_rng = pd.date_range(start='2022-01-01', end='2022-12-31', freq='D')
data = np.random.randint(30, 70, size=(len(date_rng)))
df = pd.DataFrame(data, columns=['Value'], index=date_rng)

# Calculate the Exponential Moving Average (EMA)
span = 7  # You can adjust the span parameter as needed
df['EMA'] = df['Value'].ewm(span=span, adjust=False).mean()

# Plot the original data and the Exponential Moving Average (EMA)
plt.figure(figsize=(10, 6))
plt.plot(df['Value'], label='Original Data')
plt.plot(df['EMA'], label=f'EMA (span={span})')
plt.title('Original Data and Exponential Moving Average (EMA)')
plt.xlabel('Date')
plt.ylabel('Value')
plt.legend()
plt.show()Output:
Calculating the Moving Average of Multiple Columns
We can also calculate the moving average of multiple columns using the Pandas library in Python. If you want to calculate the moving average for multiple columns in a DataFrame, you can apply the rolling window operation to each column individually.
Let us see an example:
import pandas as pd
import numpy as np
import matplotlib.pyplot as plt

# Generate a sample dataset with fewer data points and multiple columns
np.random.seed(42)
date_rng = pd.date_range(start='2022-01-01', end='2022-01-31', freq='D')  # Fewer data points
data = np.random.randint(30, 70, size=(len(date_rng), 3))
df = pd.DataFrame(data, columns=['Column1', 'Column2', 'Column3'], index=date_rng)

# Calculate and plot the moving averages for each column
window_size = 3  # Adjusted window size for fewer data points

# Iterate over each column
for column in df.columns:
    # Create a new column for the moving average
    df[f'{column}_MA'] = df[column].rolling(window=window_size).mean()

# Plot original data and moving averages
plt.figure(figsize=(10, 6))

# Plot original data
df[['Column1', 'Column2', 'Column3']].plot(marker='o', linestyle='-', alpha=0.7, label='Original Data')

# Plot moving averages
df[['Column1_MA', 'Column2_MA', 'Column3_MA']].plot(linestyle='--', alpha=0.7, label=f'Moving Average (Window={window_size})')

plt.title('Original Data and Moving Averages for Multiple Columns')
plt.xlabel('Date')
plt.ylabel('Value')
plt.legend()
plt.show()Output:


Conclusion
In this article, we have discussed the Moving Average and its calculation using the Pandas library in Python. We covered the simple moving average (SMA), weighted moving average (WMA), and exponential moving average (EMA). Each type of moving average has its characteristics and applications and can provide valuable insights into time series data.