Researchers are finding it increasingly difficult to comprehend the underlying workings of Machine learning models as they become more complicated. Google’s new tool might help to visualize them correctly!
Highlights:
- Google released Model Explorer, an open-source tool for understanding the inner workings of AI models.
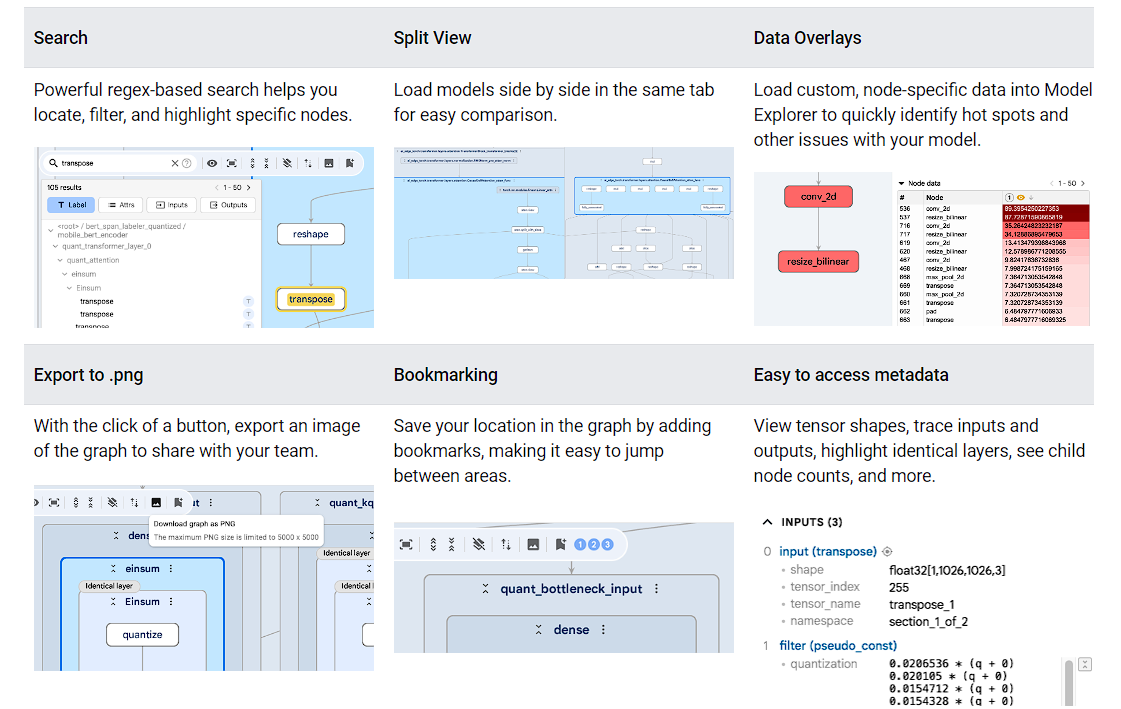
- This graph visualization tool provides a hierarchical layout, interactive navigation, and per-node data overlay.
- It has abilities to handle large-scale models with ease, along with a hierarchical visualisation technique.
Meet Google’s Model Explorer
Google has released a new open-source tool called Model Explorer that offers numerous benefits for exploring Machine Learning models in-depth and analyzing their inner workflows.
It is an effective graph visualization tool for understanding, debugging, and optimizing these models. It functions well for smaller models as well, but it excels at providing enormous graphs in an understandable, hierarchical fashion.
Here is how they explained in their annoucement blog:
“Model Explorer is a powerful graph visualization tool that helps one understand, debug, and optimize ML models. It specializes in visualizing large graphs in an intuitive, hierarchical format, but works well for smaller models as well.”
When it comes to expediting the deployment of large models to on-device platforms, where visualizing conversion, quantization, and optimization data is particularly useful, Model Explorer has shown to be quite effective.
Model Explorer has already shown its value to Google by making it easier to deploy huge models on platforms with limited resources, such as mobile devices. The tool offers a Python API that enables engineers to integrate it directly into their machine learning workflows, as well as a graphical user interface that meets a range of visualization demands.
Additionally, it supports a variety of graph formats, such as those utilized by PyTorch, TensorFlow, JAX, and TensorFlow Lite. With support for all these varieties, the tool can be highly efficient on a large scale for working with a variety of models.
How to Access It?
There are two ways to use Model Explorer from Google. You can run it locally on your browser window or you can run it on a colab notebook. Model Explorer can be easily installed on your local computer by following the GitHub instructions. All of your data is local and it operates within a browser window. Supports Mac, Windows, and Linux.
Since Model Explorer functions smoothly in Colab, you can incorporate it into your current model creation process. To add it to your own notebook, either try the trial model or follow the installation instructions.
Understanding its Use Cases
Three types of use cases are made possible by Model Explorer when creating huge models: comprehending the model architecture, troubleshooting conversion difficulties, and troubleshooting performance and numerical concerns.
1) Comprehending the model architecture
Google has made significant progress in demystifying the intricate realm of artificial intelligence with the release of Model Explorer. The technology provides unparalleled insight into the inner workings of artificial intelligence (AI) by enabling researchers and developers to look into the most complex neural networks.
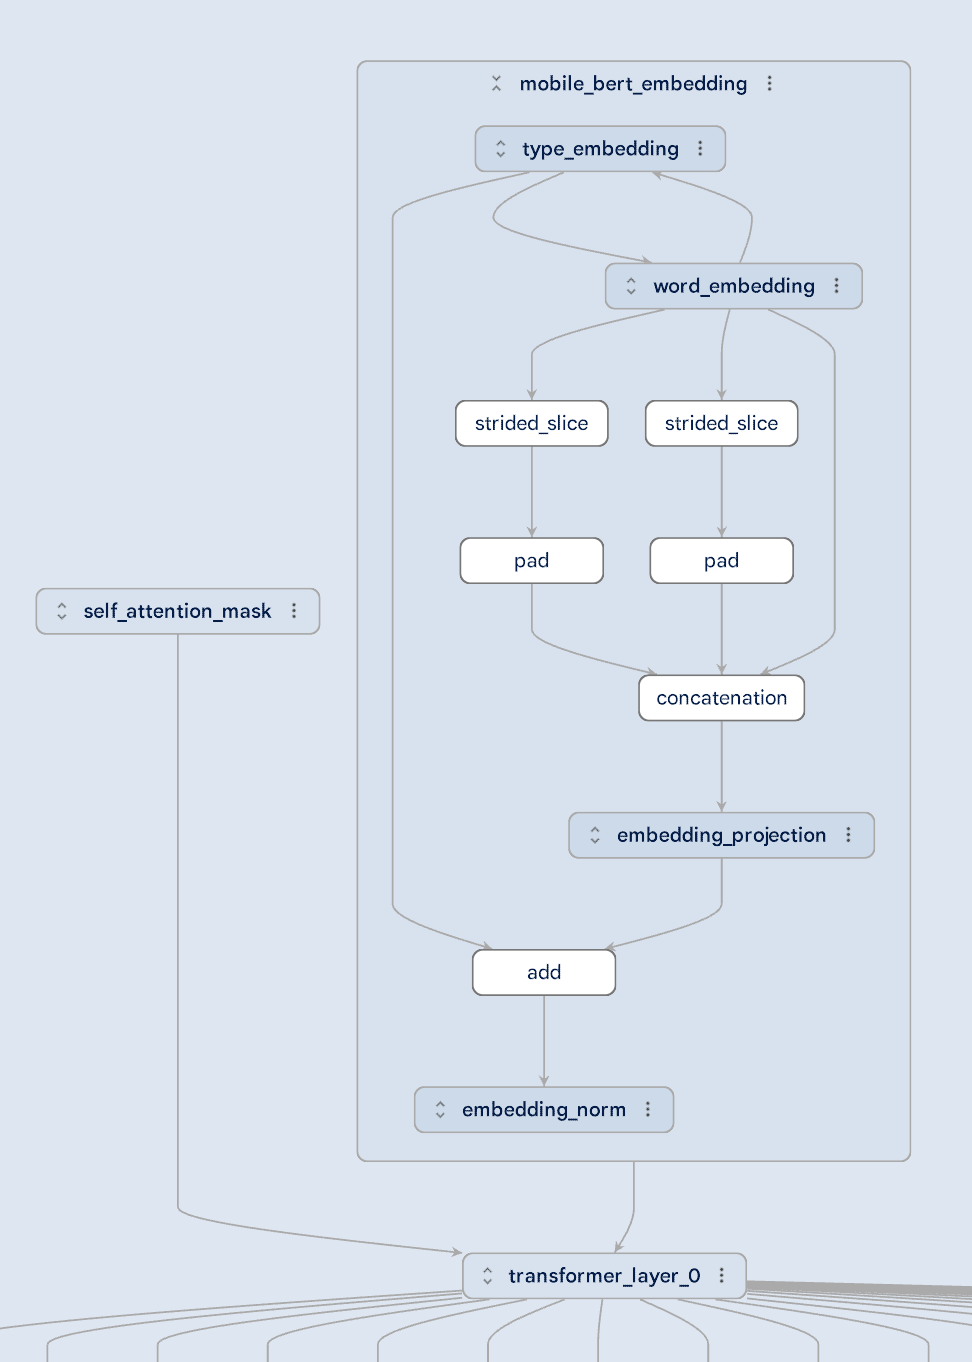
Navigating intricate systems and layer-based perspectives makes large models easier to understand. Here’s an example from Google’s official blog where you can see an enhanced view of the MobileBert model.

The relationships between various embedding kinds are displayed in the embedding layer’s expanded view. Without this hierarchical information, this model—which has approximately 2,000 nodes in total—would be very difficult to comprehend.
2) Troubleshooting Conversion Difficulties
ML models must undergo a conversion procedure, such as turning a PyTorch model into a Tensorflow Lite model, before being deployed onto certain hardware, such as phones or laptops. Nevertheless, during conversion, information concerning the transformation is frequently lost.
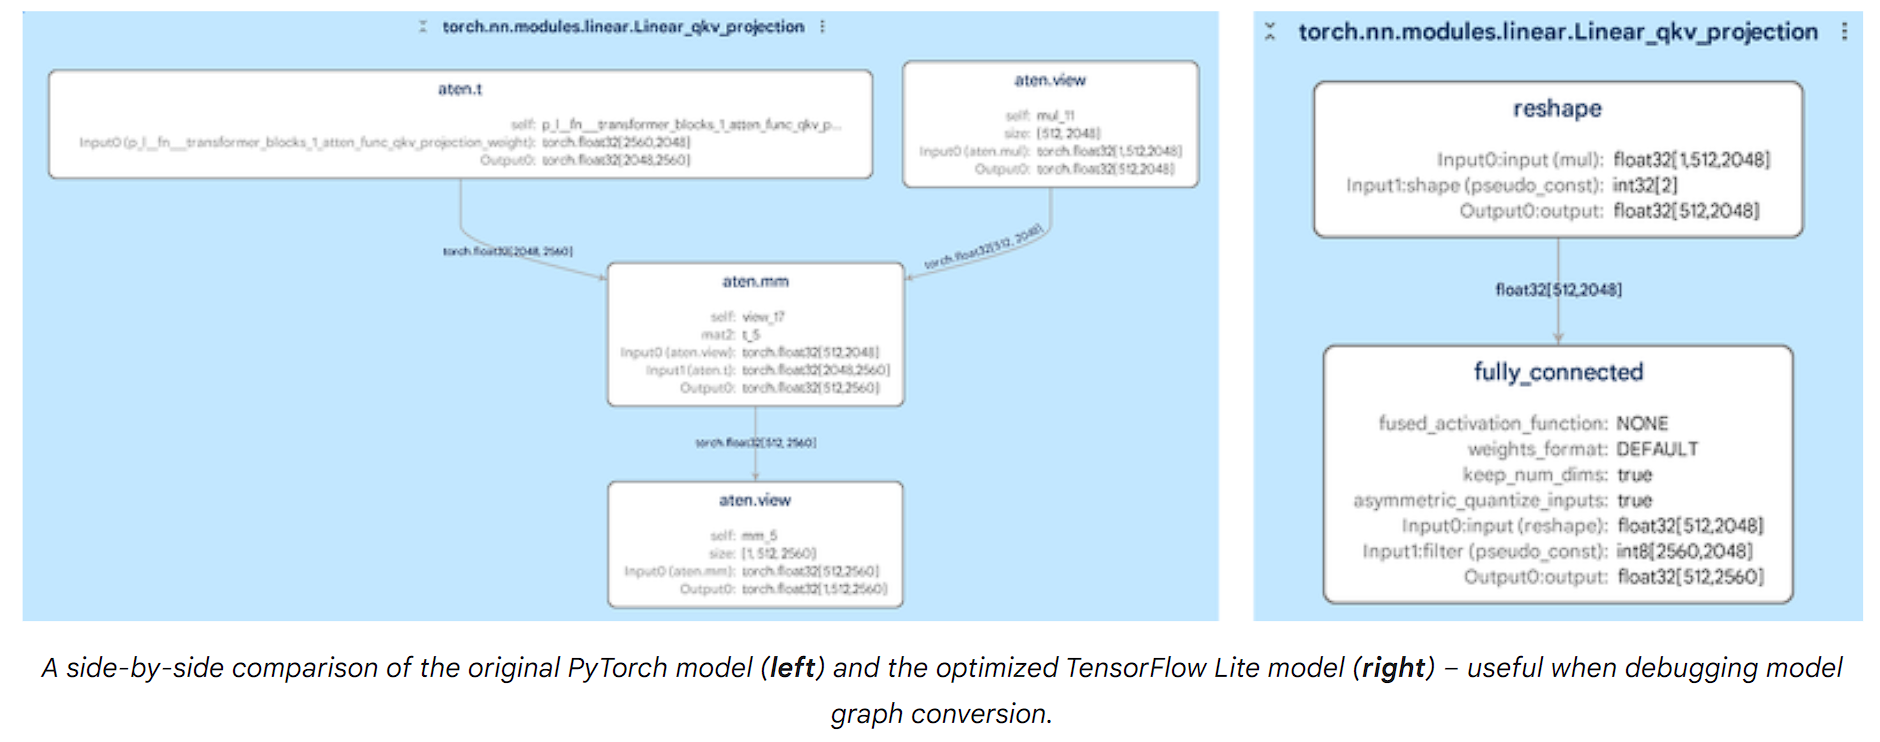
Model Explorer has a side-by-side comparison option to facilitate the comparison of numerous graphs.
The following example illustrates the changes made to the torch.nn.modules.linear.Linear_attn, subgraph within one layer, during the PyTorch to TensorFlow Lite conversion. Conversion problems can be identified by comparing the layer’s input and output in terms of shape and data type.

Thus, this is a great approach to analyzing conversion errors and difficulties in various state-of-the-art machine learning models with intricate inner workings and vast graph visualizations.
To find troublesome processes impacted by quantization, use Model Explorer. To identify quality drops, sort operations based on error metrics, obtain insights for each layer and compare various quantization outcomes to determine the best model size-quality trade-off.
3) Debugging performance and numeric accuracy:
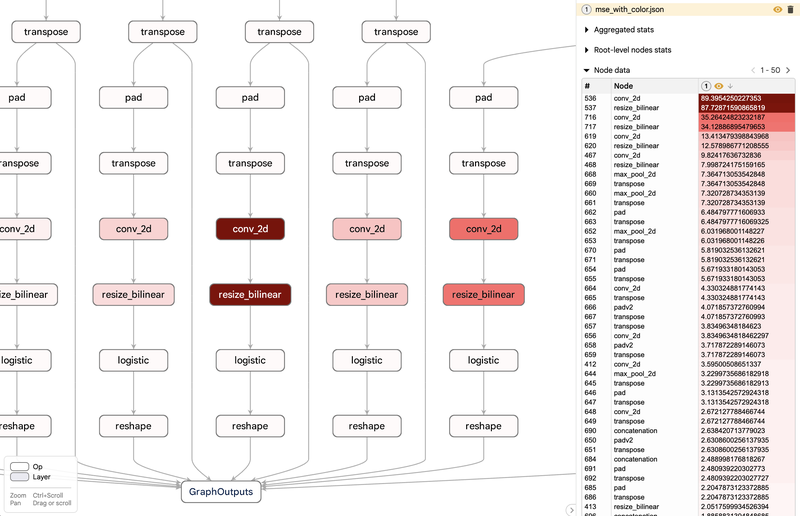
Last but not least, Model Explorer can overlay per-node data on a graph, enabling users to use the values in that data to search, sort, and style nodes.
Participants in Google’s user research reported that when used in conjunction with the hierarchical view, it makes it easier for them to immediately focus performance or numerical difficulties on a specific region of the graph. These insights would have been considerably more difficult to come by without this visualization.
This illustration compares the mean squared error of a floating point model to a quantized TFLite model. Users were able to immediately determine that the quality loss was close to the bottom of the graph by using Model Explorer, and they were also able to modify their quantization approach.

To gain a deeper understanding of the results from your debugging and benchmarking tools, use Model Explorer. Learn which operations are GPU-compatible, how to order operations based on latency, and how per-op performance varies throughout accelerators.

Overall, Model Explorer helps developers find and fix problems more rapidly by offering several perspectives on a model’s architecture, conversion procedure, and performance characteristics. This is especially useful since artificial intelligence is being used more and more on the “edge” of low-power devices.
Why this Model Explorer is Special?
The ability to handle large-scale models with ease and its hierarchical visualisation technique are what really make Model Explorer stand out. It enables researchers and developers to identify potential biases, mistakes, or unintended consequences early in the development process by giving them a clear picture of how AI models function.
This degree of openness is necessary to guarantee that AI systems are created and used responsibly, taking into account all of their advantages and disadvantages.
Tools like Model Explorer will be essential in ensuring that we can utilise AI’s potential while upholding accountability and openness as these technologies develop quickly. The capacity to examine AI models’ inner workings will be essential for fostering confidence and trust among users, decision-makers, and the general public.
Conclusion
Google’s Model Explorer offers a potent new method that doesn’t affect rendering speed or user experience for inspecting architecture and troubleshooting problems with models of nearly any size. Go try it today and enjoy its capabilities.


